LifeArchive – store all your digital assets safely (part 1 of 2)

Remember the moments when you, or your parents, found some really old pictures buried deep into some closet and you instantly get a warm and fuzzy feeling of memories? In this modern era of Cloud Services, we’re producing even more personal data which we want to retain. Pictures form your phone and your DSLR camera, documents you’ve made, non-drm games, movies and music you’ve bought etc. The list goes on and on. Todays problem is that you have so many different devices, that it’s really hard to keep up where all your data is.

One solution is to rely on a number of cloud services: Dropbox, Google, Facebook, Flickr etc can all host your images and files, but can you really rely that your data is still there after ten years? What about 30 years? What if you use a paid service and for some reason you forget to upgrade your new credit card data and the service deletes all your data? What about the files which lay on a corner of your old laptop after you bought a new shiny computer? You can’t rely that the cloud providers you use are still in business for decades to come.

The solution? Implement your own strategy by backing up all your valuable digital assets. After thinking this for a few years I finally came up with my current solution for this problem: Gather all your digital assets into one place, so that they’re easy to backup. You can still use all your cloud services like Dropbox and Facebook, but just make sure that you do automatic backups from all these services into this central storage. This way there’s only one place which you need to backup and you can easily do backups to multiple different places just for extra precaution.

First identify what’s worth saving

  • I do photography, so that’s a bunch of .DNG and .JPG images in my Lightroom archive. I don’t photograph that much, so I can easily store them all, assuming that I remove the images which have failed so badly that there’s no imaginable situation where I would want those.
  • I also like doing movies. The raw footage takes too much space that it’s worth saving, so I only archive the project files and the final version. I store the raw footage in external drives which I don’t backup into this archive.
  • Pictures from my cell phone. There’s a ton of lovely images there which I want to save.
  • Emails, text messages from my phone, comments and messages from facebook.
  • Misc project files. Be it a 3D model, a source code file related to an experiment, drawings for my new home layout etc. I produce this kind of small stuff on weekly basis and I want to keep them for future reference and for the nostalgic value.
  • This blog and the backups related to it.

I calculated that I have currently about 250GB of this personal data, spanning over a decade. I’ve planned that I can just keep adding data to this central repository during my entire life and to always transfer it to new hardware when the old breaks. In other words, this will be my entire digital legacy.

Action plan:

  1. Buy a good NAS to home
  2. Build bunch of scripts and automation to fetch all data from different cloud services to this nas
  3. Implement good backup procedures for this NAS.

The first step was quite easy. I bought a HP MicroServer, which acts as a NAS in my home. You can read more from this project from this other blog post. Second step is the most complex: I have multiple computers, an Android cell phone and a few cloud services where I have data that I want to save. I had to find existing solutions for each of these and build my own when I couldn’t find anything. The third step is easy, but it’s worth for another blog post next week.

Archive pictures, edited videos and other projects

I can access the NAS directly from my workstations via Samba/CIFS mounts over network, so I use it directly to host my Lightroom archive, edited video projects (not including raw video assets), and other project files which I tend to produce. I also use it to store drm free music, videos and ebooks which I’ve bought from internet.

Backing up Android phones

This includes pictures which I take with my phone, but also raw data and settings for applications. I found out about this nice program called Rsync for Android. It uses rsync with ssh keys to sync into a backup destination, which runs inside a OpenIndiana Zone in my NAS. Data destination dir is mounted into the zone via lofs, so that only the specific data directory is exposed to the zone. Then I use Llama to periodically run the backup.

In addition I use SMS Backup + to sync all sms and mms messages to GMail under a special “SMS” label. Works like charm!

Backing up GMail

gmvault does the trick. It uses IMAP to download new emails from GMail and it’s simple to setup.

I actually use two different instance of gmvault. They both sync my gmail account, but other deletes emails from the backup database which have been deleted from the gmail and other does not. The idea is that I can still restore my emails if somebody gains access to my gmail and deletes my all emails. I have one script in my cron that syncs the backup databases every night with the “-t quick” option.

Backup other servers

I have a few other servers, like the one where I host this blog, that needs to be backed up. I use simple rsync with ssh keys from cron, which backs up these every night. The rsync uses –backup and –backup-dir to retain some direct protection for deleted files.

Conclusions

This kind of central storage for all your digital assets needs some careful planning, but it’s an idea worth exploring. After you have established this kind of archive, you need to implement the backups, which I will talk in the next post.

This kind of archive solves the problem where you aren’t sure where all your files are – they either have a copy in the archive, or they don’t exists. Beside that, you can make some really entertaining discoveries when you crawl the helms of the archive and find some files you thought you had lost a decade ago.

Read the second part of this blog series at Setting backup solution for my entire digital legacy (part 2 of 2)

Cheap NAS with ZFS in HP MicroServer N40L

I’ve ran Solaris / OpenIndiana machines in my home for years and I just recently had to get a new one because my old server with 12 disk slots made way too much noise and consumed way too much power to my taste. Luckily hard disk sizes have grown up a big time and I could replace the old server with a smaller one and with smaller amount of disks.
hp-microserver

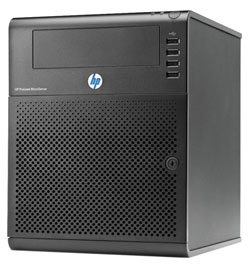
I only recently learn about the HP MicroServer product family. HP has been making these small little servers for a few years and they are really handy and really cheap for their features. I bought a HP MicroServer N40L from amazon.de, which shipped from Germany to Finland in just a week for just 242 euros. Here’s a quick summary about the server itself:

  • It’s small, quiet and doesn’t use a lot of power. According to some measurements it will use on average around 40 to 60W.
  • It has four 3.5″ non-hot-swap disk slots inside. In addition, it has eSATA on the back and a 5.25″ slot with SATA cable. These can give you two extra sata slots for total of six disks.
  • A dual core AMD Turion II Neo N40L (1.5 Ghz) processor. More than enough for a storage server.
  • It can fit two ECC dimms, totaling maximum of 8 GB memory. According to some rumors, you can fit it with two 8GB dimms to get total of 16 GB.
  • Seven USB:s. Two on the back, four on the front and one inside the chassis, soldered right into the motherboard.
  • Depending on disks and configuration, it can stretch up to 12 TB of usable disk space (assuming you install five 4TB disks) with still providing enough security to handle two simultaneous disk failures!

The machine doesn’t have any RAID features, which doesn’t mind me, because my choice of weapon was to install OpenIndiana which comes with the great ZFS filesystem, among other interesting features. If you are familiar with Linux, you can easily learn how to manage an OpenIndiana installation, it’s really easy. ZFS itself is a powerful modern filesystem which combines the best features of software raid, security, data integrity and easy administration. OpenIndiana allows you to share the space with Samba/CIFS to Windows and with AppleTalk to your Macintosh. It also supports exporting volumes with iSCSI, it provides filesystem backups with ZFS snapshots and it even can be used as storage for your Macintosh Time Machine backups. You can read more about ZFS from the Wikipedia entry.

There’s a few different product packages available: I picked the one which comes with one 4GB ECC DIMM, DVD drive and no disks. There’s at least one other package which comes with one 2GB ECC DIMM and one 250GB disk. I personally suggest the following setup where you install the operating system into a small SSD and use the spinning disks only for the data storage.

Shopping list:

  • HP MicroServer N40L with one 4GB ECC DIMM and no disks.
  • Some 60GB SSD disk for operating system. I bought a Kingston 60GB for 60 euros.
  • Three large disks. I had 2TB Hitachi drives on my shelf which I used.
  • One USB memory stick, at least 1GB and an USB keyboard. You need these only during installation.

Quick installation instructions

– First optional step: You can flash a new modified bios firmware which allows getting better performance out of the SSD disk. The instructions are available in this forum thread and in here. Please read the instructions carefully. Flashing BIOS firmware is always a bit dangerous and it might brick your MicroServer, so consider yourself warned.

– Replace the DVD drive with the SSD disk. You can use good tape to attach the SSD disk to the chassis.

– Download the newest OpenIndiana server distribution from http://openindiana.org/download/#text and install it into the USB stick with these instructions.

– Insert the USB stick with OpenIndiana into the MicroServer and boot the machine. During the setup you can change how the SSD disk is partitioned for the OS: I changed the default settings so that the OS partition was just 30GB. This is more than enough for the basic OS. My plan is to later experiment with a 25GB slice as an L2ARC cache partition for the data disks and to leave 5GB unprovisioned. This extra 5GB should give the SSD controller even more room to manage the SSD efficiently and giving it more life time without wearing out. This might sound like a bit of exaggeration, but I’m aiming to minimize the required maintenance with sacrificing some disk space.

– After installation shutdown the server, remove the USB stick and install your data disks. My choise was to use three 2TB disks in a mirrored pool. This means that I can lose two disks at the same time, giving me a good time margin to replace the failed drive. You can read some reasoning why I wanted to have triple way mirroring from this article. If you populate the drive slots from left to right, the leftmost drive will be c4t0d0, the second-from-the-left c4t1d0 etc. The exact command should be:

zpool create tank mirror c4t0d0 c4t1d0 c4t2d0

After this the system should look like this:

  
# zpool status
pool: tank
state: ONLINE
config:

        NAME        STATE     READ WRITE CKSUM
        tank        ONLINE       0     0     0
          mirror-0  ONLINE       0     0     0
            c4t0d0  ONLINE       0     0     0
            c4t1d0  ONLINE       0     0     0
            c4t2d0  ONLINE       0     0     0

Now you can create a child filesystems under the /tank storage pool to suit your needs:

# zfs create tank/lifearchive
# zfs create tank/crashplan_backups
# zfs list
NAME                     USED  AVAIL  REFER  MOUNTPOINT
tank                     393G  1.40T    35K  /tank
tank/crashplan_backups  18.8G  1.40T  18.8G  /tank/crashplan_backups
tank/lifearchive         133G  1.40T   133G  /tank/lifearchive

Here I created two filesystems: One for crashplan backups from other machines and other for storing all my important digital heritage. Next I wanted to export this filesystem to Windows via the Samba sharing system:

# zfs set "sharesmb=name=lifearchive" tank/lifearchive
echo "other password required pam_smb_passwd.so.1 nowarn" >> /etc/pam.conf

In addition I had to add this line to /etc/pam.conf and change my password with “passwd” command after adding that line. Now you should be able to browse the lifearchive filesystem from windows.

Few additional steps you probably want to do:

Now when you got your basic system working you can do a few tricks to get it to work even better. Before you continue, snapshot your current state as explained in the next chapter:

Snapshot your root filesystem

After you’ve done everything as you want you should snapshot this situation as a new boot environment. This way if you do something very stupid and you render your system unusable, you can always boot the machine to the snapshotted state. The command “beadm create -e openindiana openindiana-baseline” will do the trick. Read here what it actually does! Note that this does not cover your data pool, so you might also want to create some snapshot backup system for that. Googling for “zfs snapshot backup script” should get you started.

Email alerts

Verify that you can send email out from the box, so that you can get alerts if one of your disk breaks. You can try this with for example the command “mail your.email@gmail.com”. Type your email and press Ctrl-D to send the email. At least in gmail your email might end up in the spam folder. My choice was to install Postfix and configure it to relay emails via the Google SMTP gateway. The exact steps are beyond the scope of this article, but here’s few tips:

  1. First configure to use SFE repositories: http://wiki.openindiana.org/oi/Spec+Files+Extra+Repository
  2. Stop sendmail: “svcadm disable sendmail”
  3. Remove sendmail: “pkg uninstall sendmail”
  4. Install postfix with “pkg install postfix”
  5. Follow these steps http://carlton.oriley.net/blog/?p=31 – at least the PKI certificate part is confusing. You need to read some documentation around the net to get this part right.
  6. Configure the FMA system to send email alerts with these instructions. Here’s also some other instructions which I used.

Backup your data

I’ve chosen to use Crashplan to back up my data to the Crashplan cloud and to another server over the internet. In addition I use Crashplan to backup my workstation into this NAS – that’s what the /tank/crashplan_backups filesystem was for.

Periodic scrubbing for the zpool

ZFS has a nice feature called scrubbing: This operation will scan over all stored data and verify that each and every byte in each and every disk is stored correctly. This will alert you from a possible upcoming disk breakage when there’s yet no permanent damage. The command is “zpool scrub tank” where “tank” is the name of the zpool. You should setup a crontab operation to do this every week. Here’s one guide how to do it: http://www.nickebo.net/periodic-zpool-scrubbing/

Optimize nginx ssl termination cpu usage with cipher selection

I have a fairy typical setup where I have nginx in front of haproxy, where nginx is terminating the ssl connections from client browsers. As our product grew, my loadbalancer machines didn’t have enough CPU to do all the required ssl processing.

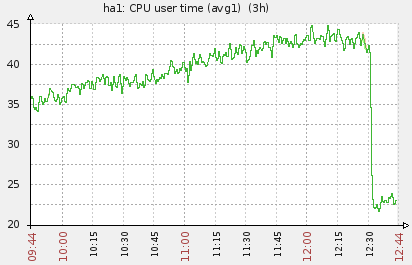
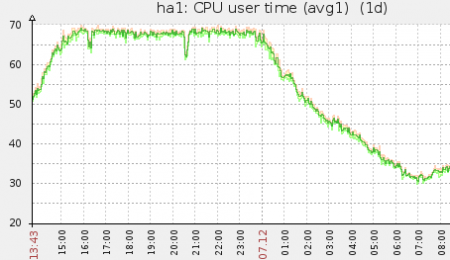
As this zabbix screenshot shows, the nginx takes more and more cpu, until it hits the limit of our AWS c1.xlarge instance. This causes delays for our users and some requests might even time out.

Luckily it turns out that there was a fairy easy way to solve this. nginx defaults, at least in our environment, into a cipher called DHE-RSA-AES256-SHA. This cipher uses Diffie-Hellman Ephemeral key exchange protocol, which uses a lot of CPU. With help from this and this blog posts I ended up with the following sollution:

First check if your server uses the slow DHE-RSA-AES256-SHA cipher:

openssl s_client -host your.host.com -port 443

Look for the following line:

Cipher    : DHE-RSA-AES256-SHA

This tells us that we can optimize the CPU usage by selecting faster cipher. Because I’m using AWS instances and these instances don’t support the AESNI (Hardware accelerated processor instructions for calculationg AES) I ened up with following cipher list (read more what this means from here):

RC4-SHA:AES128-SHA:AES:!ADH:!aNULL:!DH:!EDH:!eNULL

If your box can support AESNI you might want to prefer AES over RC4. It’s not the safest cipher choice out there, but more than good enough for our use. Check out this blog post for more information.

So, I added these two lines to my nginx.conf

ssl_ciphers RC4-SHA:AES128-SHA:AES:!ADH:!aNULL:!DH:!EDH:!eNULL;
ssl_prefer_server_ciphers on;

After restarting nginx you should verify that the correct cipher is now selected by running the openssl s_client command again. In my case it now says:

Cipher    : RC4-SHA

All done! My CPU load graphs also shows a clear performance boost. Nice and easy victory.


Why Open-sourcing Components Increases Company Productivity and Product Quality

We’re big fans of open source community here at Applifier. So much, that we believe that open-sourcing software components and tools developed in-house will result in better quality, increased cost savings and increased productivity. Here’s why:

We encourage our programmers to design and implement components, which aren’t our core business, into reusable packages which will be open-sourced once the package is ready. The software is distributed on our GitHub site, with credits to each individual who contributed into the software.

Because the programmers know that their full name will be printed all over the source code, and they can be later Google’d with it, they will take better care to ensure that the quality standards are high enough to stand a closer look. This means:

  • Better overall code quality. Good function/parameter names, good packages, no unused functions etc.
  • Better modularization. The component doesn’t have as much dependencies to other systems, which is generally considered as a good coding practice.
  • Better tests and test coverage. Tests are considered to be essential part of modern code development, so you’ll want to show everybody that you know your business, right?
  • Better documentation. The component is published so that anybody can use it, so it must have good documentation and usage instructions.
  • Better backwards compatibility. Coders take better care when they design API’s and interfaces because they know that somebody might be using the component somewhere out there.
  • Better security. Coder knows that anybody will be able to read his code and find security holes, thus he takes better care for not making any.

In practice, we have found that all the open source components have higher code and document quality than any of our non-published software component. This also ensures that the components are well documented and can be easily maintained if the original coders leave the company. This gives good cost savings in the long run. Open-sourcing components also gives your company good PR value and makes you more attractive for future employers.

For example one of our new guy was asked to do a small monitoring component to monitor some data from RightScale and transfer it into Zabbix, which is our monitoring system. Once the person said that the component was completed, I said to him: “Good, now polish it so that you dare to publish it with your own name in GitHub.”

Adding new storage tank with diskmap.py.

We recently added a bunch of Western Digital 3.0TB Green drives to the enclosure, so that we can run a bunch of tests with this brand. Here’s a quick recap what I had to do to make these new disks online.

First run the diskmap.py. the bold lines are my commands which I wrote. First I discover for new drives (it might that the diskmap shows an old cache without the new drivers) and then I ask it to lisk all disks.

root@openindiana:/export/home/garo# diskmap.py
Diskmap - openindiana> discover
Diskmap - openindiana> disks
0:02:00 c2t5000C5003EF23025d0 ST33000651AS 3.0T Ready (RDY) tank: raidz3-0
0:02:01 c2t5000C5003EEE6655d0 ST33000651AS 3.0T Ready (RDY) tank: raidz3-0
0:02:02 c2t5000C5003EE17259d0 ST33000651AS 3.0T Ready (RDY) tank: raidz3-0
0:02:03 c2t5000C5003EE16F53d0 ST33000651AS 3.0T Ready (RDY) tank: raidz3-0
0:02:04 c2t5000C5003EE5D5DCd0 ST33000651AS 3.0T Ready (RDY) tank: raidz3-0
0:02:05 c2t5000C5003EE6F70Bd0 ST33000651AS 3.0T Ready (RDY) tank: raidz3-0
0:02:06 c2t5000C5003EEF8E58d0 ST33000651AS 3.0T Ready (RDY) tank: raidz3-0
0:02:07 c2t5000C5003EF0EBB8d0 ST33000651AS 3.0T Ready (RDY) tank: raidz3-0
0:02:08 c2t5000C5003EF0F507d0 ST33000651AS 3.0T Ready (RDY) tank: raidz3-0
0:02:09 c2t5000C5003EECE68Ad0 ST33000651AS 3.0T Ready (RDY) tank: raidz3-0
0:02:10 c2t5000C5003EF2D1D0d0 ST33000651AS 3.0T Ready (RDY) tank: spares
0:02:12 c2t5000C5003EEEBC8Cd0 ST33000651AS 3.0T Ready (RDY) tank: spares
0:02:13 c2t5000C5003EE49672d0 ST33000651AS 3.0T Ready (RDY) tank: spares
0:02:14 c2t5000C5003EEE7F2Ad0 ST33000651AS 3.0T Ready (RDY) tank: raidz3-0
0:02:15 c2t5000C5003EED65BBd0 ST33000651AS 3.0T Ready (RDY)
0:03:10 c2t50014EE2B1158E58d0 WDC WD30EZRX-00M 3.0T Ready (RDY)
0:03:11 c2t50014EE2B11052C3d0 WDC WD30EZRX-00M 3.0T Ready (RDY)
0:03:12 c2t50014EE25B963A7Ed0 WDC WD30EZRX-00M 3.0T Ready (RDY)
0:03:13 c2t50014EE2B1101488d0 WDC WD30EZRX-00M 3.0T Ready (RDY)
0:03:14 c2t50014EE2B0EBFF8Ad0 WDC WD30EZRX-00M 3.0T Ready (RDY)
0:03:15 c2t50014EE25BBB4F91d0 WDC WD30EZRX-00M 3.0T Ready (RDY)
0:03:16 c2t50014EE2066AB19Fd0 WDC WD30EZRX-00M 3.0T Ready (RDY)
0:03:17 c2t50014EE25BBFCAB0d0 WDC WD30EZRX-00M 3.0T Ready (RDY)
0:03:18 c2t50014EE2066686C6d0 WDC WD30EZRX-00M 3.0T Ready (RDY)
0:03:19 c2t50014EE2B1158F6Fd0 WDC WD30EZRX-00M 3.0T Ready (RDY)
0:03:20 c2t50014EE2B0E99EA1d0 WDC WD30EZRX-00M 3.0T Ready (RDY)
1:01:00 c2t50015179596901EBd0 INTEL SSDSA2CT04 40.0G Ready (RDY) rpool: mirror-0
1:01:01 c2t50015179596A488Cd0 INTEL SSDSA2CT04 40.0G Ready (RDY) rpool: mirror-0
Drives : 28 Total Capacity : 78.1T
Diskmap - openindiana>

I colored the new disk ids with yellow for your reading pleasure. Next I copied all those 11 ids and I formed the following command, which creates a new tank. I also reused the three old spares, those disk ids are marked with green

zpool create tank2 raidz3 c2t50014EE2B1158E58d0 ... c2t5000C5003EE49672d0 spares c2t5000C5003EF2D1D0d0 c2t5000C5003EEEBC8Cd0 c2t5000C5003EE49672d0

All set! I could now access the new 30TB volume under /tank2.

Building a 85TB cheap storage server with Solaris OpenIndiana

I just recently built a storage server based on Solaris OpenIndiana, a 2U SuperMicro server and a SuperMicro 45 disk JBOD rack enclosure. The current configuration can host 84 TB of usable disk space, but we plan to extend this at least to 200TB in the following months. This blog entry describes the configuration and steps how to implement such beast by yourself.

Goal:

  • Build a cheap storage system capable of hosting 200TB of disk space.
  • System will be used to archive data (around 25 GB per item) which is written once and then accessed infrequently (once every month or so).
  • System must be tolerant to disk failures, hence I preferred raidz3 which can handle a failure of three disks simultaneously.
  • The capacity can be extended incrementally by buying more disks and more enclosures.
  • Each volume must be at least 20TB, but doesn’t have to be necessarily bigger than that.
  • Option to add a 10GB Ethernet card in the future.
  • Broken disks must be able to identify easily with a blinking led.

I choose to deploy an OpenIndiana based system which uses SuperMicro enclosures to host cheap 3TB disks. Total cost of the hardware with one enclosure was around 6600 EUR (2011 Dec prices) without disks. Storing 85TB would cost additional 14000 EUR with current very expensive (after the Thailand floods) disk prices. Half a year ago the the same disks would have been about half of that. Disks would be deployed in a 11-disk raidz3 sets, one or two per zpool. This gives us about 21.5TB per 11 disk set. New storage is added as a new zpool instead of attaching it to an old zpool.

Parts used:

  • The host is based on a Supermicro X8DTH-6F server motherboard with two Intel Xeon E5620 4-core 2.4 Ghz CPUs and 48 GB of memory. Our workload didn’t need more memory, but one could easily add more.
  • Currently one SC847E16-RJBOD1 enclosure. This densely packed 4U chassis can fit a whopping 45 disks.
  • Each chassis is connected to a LSI Logic SAS 9205-8e HBA controller with two SAS cables. Each enclosure has two backplanes, so both backplanes are connected to the HBA with one cable.
  • Two 40GB Intel 320-series SSDs for the operating system.
  • Drives from two different vendor so that we can have some benchmarks and tests before we commit to the 200TB upgrade:
    • 3TB Seagate Barracuda XT 7200.12 ST33000651AS disks
    • Western Digital Caviar Green 3TB disks

It’s worth to note that this system is built for storing large amounts of data which are not frequently accessed. We could easily add SSD disks as L2ARC caches and even a separated ZIL (for example the 8 GB STEC ZeusRAM DRAM, which costs around 2200 EUR) if we would need faster performance for example database usage. We selected disks from two different vendors for additional testing. One zpool will use only disks of a single type. At least the WD Green drives needs a firmware modification so that they don’t park their heads all the time.

Installation:

OpenIndiana installation is easy: Create a bootable CD or a bootable USB and boot the machine with just the root devices attached. The installation is very simple and takes around 10 minutes. Just select that you install the system to one of your SSDs with standard disk layout. After your installation is completed and you have booted the system, follow these steps to make the another ssd bootable.

Then setup some disk utils under /usr/sbin. You will need these utils to for example identify the physical location of a broken disk in the enclosure. (read more here):

Now it’s time to connect your enclosure to the system with the SAS cables and boot it. OpenIndiana should recognize the new storage disks automatically. Use the diskmap.py to get a list of the disk identifies for later zpool create usage:

garo@openindiana:/tank$ diskmap.py
Diskmap - openindiana> disks
0:02:00 c2t5000C5003EF23025d0 ST33000651AS 3.0T Ready (RDY)
0:02:01 c2t5000C5003EEE6655d0 ST33000651AS 3.0T Ready (RDY)
0:02:02 c2t5000C5003EE17259d0 ST33000651AS 3.0T Ready (RDY)
0:02:03 c2t5000C5003EE16F53d0 ST33000651AS 3.0T Ready (RDY)
0:02:04 c2t5000C5003EE5D5DCd0 ST33000651AS 3.0T Ready (RDY)
0:02:05 c2t5000C5003EE6F70Bd0 ST33000651AS 3.0T Ready (RDY)
0:02:06 c2t5000C5003EEF8E58d0 ST33000651AS 3.0T Ready (RDY)
0:02:07 c2t5000C5003EF0EBB8d0 ST33000651AS 3.0T Ready (RDY)
0:02:08 c2t5000C5003EF0F507d0 ST33000651AS 3.0T Ready (RDY)
0:02:09 c2t5000C5003EECE68Ad0 ST33000651AS 3.0T Ready (RDY)
0:02:11 c2t5000C5003EF2D1D0d0 ST33000651AS 3.0T Ready (RDY)
0:02:12 c2t5000C5003EEEBC8Cd0 ST33000651AS 3.0T Ready (RDY)
0:02:13 c2t5000C5003EE49672d0 ST33000651AS 3.0T Ready (RDY)
0:02:14 c2t5000C5003EEE7F2Ad0 ST33000651AS 3.0T Ready (RDY)
0:03:20 c2t5000C5003EED65BBd0 ST33000651AS 3.0T Ready (RDY)
1:01:00 c2t50015179596901EBd0 INTEL SSDSA2CT04 40.0G Ready (RDY) rpool: mirror-0
1:01:01 c2t50015179596A488Cd0 INTEL SSDSA2CT04 40.0G Ready (RDY) rpool: mirror-0
Drives : 17 Total Capacity : 45.1T

Here we have total of 15 disks. We’ll use 11 of them to for a raidz3 stripe. It’s important to have the correct amount of drivers in your raidz configurations to get optimal performance with the 4K disks. I just simply selected the first 11 disks (c2t5000C5003EF23025d0, c2t5000C5003EEE6655d0, … , c2t5000C5003EF2D1D0d0) and created a new zpool with them and also added three spares for the zpool:

zpool create tank raidz3 c2t5000C5003EF23025d0, c2t5000C5003EEE6655d0, ... , c2t5000C5003EF2D1D0d0
zpool add tank spare c2t5000C5003EF2D1D0d0 c2t5000C5003EEEBC8Cd0 c2t5000C5003EE49672d0

This resulted in a nice big tank:

        NAME                       STATE     READ WRITE CKSUM
        tank                       ONLINE       0     0     0
          raidz3-0                 ONLINE       0     0     0
            c2t5000C5003EF23025d0  ONLINE       0     0     0
            c2t5000C5003EEE6655d0  ONLINE       0     0     0
            c2t5000C5003EE17259d0  ONLINE       0     0     0
            c2t5000C5003EE16F53d0  ONLINE       0     0     0
            c2t5000C5003EE5D5DCd0  ONLINE       0     0     0
            c2t5000C5003EE6F70Bd0  ONLINE       0     0     0
            c2t5000C5003EEF8E58d0  ONLINE       0     0     0
            c2t5000C5003EF0EBB8d0  ONLINE       0     0     0
            c2t5000C5003EF0F507d0  ONLINE       0     0     0
            c2t5000C5003EECE68Ad0  ONLINE       0     0     0
            c2t5000C5003EEE7F2Ad0  ONLINE       0     0     0
        spares
          c2t5000C5003EF2D1D0d0    AVAIL
          c2t5000C5003EEEBC8Cd0    AVAIL
          c2t5000C5003EE49672d0    AVAIL

Setup email alerts:

OpenIndiana will have a default sendmail configuration which can send email to the internet via directly connecting to the destination mail port. Edit your /etc/aliases to add a meaningful destination for your root account and type newaliases after you have done your editing. Then follow this guide and setup email alerts to get notified when you lose a disk.

Snapshot current setup as a boot environment:

OpenIndiana boot environments allows you to snapshot your current system as a backup, so that you can always reboot your system to a known working state. This is really handy when you do system upgrades, or experiment with something new. beadm list shows the default boot environment:

root@openindiana:/home/garo# beadm list
BE Active Mountpoint Space Policy Created
openindiana NR / 1.59G static 2012-01-02 11:57
There we can see our default openindiana boot environment, which is both active (N) and will be activated upon next reboot (R). The command beadm create -e openindiana openindiana-baseline will snapshot the current environment into new openindiana-baseline which acts as a backup. This blog post at c0t0d0s0 as a lot of additional information how to use the beadm tool.

What to do when a disk fails?

The failure detection system will email you a message when the zfs system detects a problem with system. Here’s an example of the results when we removed a disk on the fly:

Subject: Fault Management Event: openindiana:ZFS-8000-D3
SUNW-MSG-ID: ZFS-8000-D3, TYPE: Fault, VER: 1, SEVERITY: Major
EVENT-TIME: Mon Jan 2 14:52:48 EET 2012
PLATFORM: X8DTH-i-6-iF-6F, CSN: 1234567890, HOSTNAME: openindiana
SOURCE: zfs-diagnosis, REV: 1.0
EVENT-ID: 475fe76a-9410-e3e5-8caa-dfdb3ec83b3b
DESC: A ZFS device failed. Refer to http://sun.com/msg/ZFS-8000-D3 for more information.
AUTO-RESPONSE: No automated response will occur.
IMPACT: Fault tolerance of the pool may be compromised.
REC-ACTION: Run ‘zpool status -x’ and replace the bad device.

Log into the machine and execute zpool status to get detailed explanation which disk has been broken. You should also see that a spare disk has been activated. Look up the disk id (c2t5000C5003EEE7F2Ad0 in this case) from the print.

        NAME                       STATE     READ WRITE CKSUM
        tank                       ONLINE       0     0     0
          raidz3-0                 ONLINE       0     0     0
            c2t5000C5003EF23025d0  ONLINE       0     0     0
            c2t5000C5003EEE6655d0  ONLINE       0     0     0
            c2t5000C5003EE17259d0  ONLINE       0     0     0
            c2t5000C5003EE16F53d0  ONLINE       0     0     0
            c2t5000C5003EE5D5DCd0  ONLINE       0     0     0
            c2t5000C5003EE6F70Bd0  ONLINE       0     0     0
            c2t5000C5003EEF8E58d0  ONLINE       0     0     0
            c2t5000C5003EF0EBB8d0  ONLINE       0     0     0
            c2t5000C5003EF0F507d0  ONLINE       0     0     0
            c2t5000C5003EECE68Ad0  ONLINE       0     0     0
            spare-10
              c2t5000C5003EEE7F2Ad0  UNAVAIL       0     0     0  cannot open
              c2t5000C5003EF2D1D0d0 ONLINE       0     0     0 132GB resilvered
        spares
          c2t5000C5003EF2D1D0d0    INUSE     currently in use
          c2t5000C5003EEEBC8Cd0    AVAIL
          c2t5000C5003EE49672d0    AVAIL

Start the diskmap.py and execute command “ledon c2t5000C5003EEE7F2Ad0″. You should now see a blinking red led on the broken disk. You should also try to unconfigure the disk first via cfgadm: Type cfgadm -al to get a list of your configurable devices. You should find your faulted disk from a line like this:

c8::w5000c5003eee7f2a,0        disk-path    connected    configured   unknown

Notice that our disk id in zpool status was c2t5000C5003EEE7F2Ad0, so it will show in the cfgadm print as “c8::w5000c5003eee7f2a,0″. Now try and type cfgadm -c unconfigure c8::w5000c5003eee7f2a,0 I’m not really sure is this part needed, but our friends at #openindiana irc channel recommended doing this.

Now remove the physical disk which is blinking the red led and plug a new drive back. OpenIndiana should recognize the disk automatically. You can verify this by running dmesg:

genunix: [ID 936769 kern.info] sd17 is /scsi_vhci/disk@g5000c5003eed65bb
genunix: [ID 408114 kern.info] /scsi_vhci/disk@g5000c5003eed65bb (sd17) online

Now start diskmap.py, run discover and then disks and you should see your new disk c2t5000C5003EED65BBd0. Now you need to replace the faulted device with thew new one: zpool replace tank  c2t5000C5003EEE7F2Ad0 c2t5000C5003EED65BBd0. The zpool should now start resilvering the new replacement disk. The spare disk is still attached and must be manually removed after the resilvering is completed: zpool detach tank  c2t5000C5003EF2D1D0d0. There’s more info and examples at the Oracle manuals which you should read.

As you noted, there’s a lot manual operations which needs to be done. Some of these can be automated and the rest can be scripted. Consult at least the zpool man page to know more.

Benchmarks:

Simple sequential read and write benchmark against a 11 disks raidz3 in a single stripe was done with dd if=/dev/zero of=/tank/test bs=4k and monitoring the performance with zpool iostat -v 5

Read performance with bs=4k: 500MB/s
Write performance with bs=4k: 450MB/s
Read performance with bs=128k: 900MB/s
Write performance with bs=128k: 600MB/s

I have not done any IOPS benchmarks, but knowing how the raidz3 works, the IOPS performance should be about the same than one single disk can do. The 3TB Seagate Barracuda XT 7200.12 ST33000651AS can do (depending on threads) 50 to 100 iops. CPU usage tops at about 20% during the sequential operations.

Future:

We’ll be running more tests, benchmarks and watch for general stability in the upcoming months. We’ll probably fill the first enclosure gradually in the new few months with total of 44 disks, resulting around 85TB of usable storage. Once this space runs out we’ll just buy another enclosure, another 9205-8e HBA controller and start filling that.

Update 2012-12-11:

It’s been almost a year after I built this machine to one of my clients and I have to say that I’m quite pleased with this thing. The system has now three tanks of storage, each is a raidz3 spanning over 11 disks. Nearly every disk has worked just fine so far, I think we’ve had just one disk crash during the year. The disk types reported with diskmap.py are “ST33000651AS” and “WDC WD30EZRX-00M”, all 3TB disks. The Linux client side has had a few kernel panics, but I have no idea if those are related to the nfs network stack or not.

One of my reader also posted a nice article at http://www.networkmonkey.de/emulex-fibrechannel-target-unter-solaris-11/ – be sure to check that out also.
 

SuperMicro JBOD SC847E16-RJBOD1 enclosure with Solaris OpenIndiana

I’ve just deployed a OpenIndiana storage system which uses a SuperMicro JBOD SC847E16-RJBOD1 45 disk enclosure and an LSI Logic SAS 9205-8e HBA controller with OpenIndiana (build 151a). This enclosure allows you to fit huge amount of storage into just 4U rack space.

There’s a great utility called sas2ircu. Together with diskmap.py, these allows you to:

  • Identify where your disks are in your enclosure
  • Toggle the disk locator identify led on and off.
  • Run a smartcl test

So I can now locate my faulted disk with a clear blinking red led so that I can replace it safely.

Installation: Copy both binaries to /usr/sbin and you’re ready to go. Try first running diskmap.py and execute the discover command. Then you can list your disks and their addresses in the enclosure by saying disks.

There’s also the great lsiutil tool available. You need to find the 1.63 version which supports the 9205-8e controller. Unfortunately for some reason LSI has not yet made this tool available on their site. You can download it in the mean time from here: http://www.juhonkoti.net/media/LSIUTIL-1.63.zip

Implementing Multi Level Security in Windows 7 with VirtualBox and VMLite

I’ve been experimenting with a Multi Level Security implementation in Windows 7 using VirtualBox and VMLite to run Chrome and other browsers inside a virtual machine (guest system) and to use this browser as the default browser for the entire computer (host system) for additional security. This setup allows to click any HTTP link inside pretty much any running program and make that url to load itself into a browser running inside the virtual machine.

This gives us an extra layer of security besides the normal Chrome sandboxing. Also all other usual VM features like snapshotting, reverting to a snapshot, clipboard between host and guest operation system, seamless mode, networking etc are all available. In practice the software running inside VM can’t be easily tell apart from non virtualized programs.

VMLite Workstation is a software built upon VirtualBox which allows to run a Windows XP instance in Seamless mode over a host operating system (Windows 7 in this case). You need a Windows XP license which is available at least with Windows 7 Professional version. This guide shows how to install Windows XP Mode which comes with Windows 7 Professional into a virtual machine and to configure a Chrome browser inside the VM to act as the default browser for the host operating system.

Installation Instructions for VMLites and the Windows XP virtual image:

  1. Download Virtual XP Mode from http://www.microsoft.com/windows/virtual-pc/download.aspx and install it with the default settings.
  2. Download VMLite Workstation from http://www.vmlite.com/index.php/products/vmlite-workstation
  3. Create new Virtual Image inside the VMLite workstation and give it  the installation location of the Virtual XP Mode.
  4. Now you should be able to boot the Virtual XP Mode within VMLite and install Chrome and other softwares which you feel you might need. Here’s a list for ideas which you should do:
    • Change Chrome theme to something else so you can tell apart the Chrome which runs inside the guest vm and the Chrome which runs in your host system.
    • Edit the VM settings to disable full read/write access to the shared folders and drivers and instead just give one predefined directory which you use to transfer files between the guest and the host operating systems.
  5. Remember to take a snapshot from the VM after you have setup your environment. This acts as a restore point in time so you can always reset your VM into this state if you do something stupid or think that the VM is compromised.

Making the Chrome inside VM to be the default browser for everything.

VMLite comes with a “Internet Explorer (secure)” shortcut with green borders which is installed onto your desktop. This shortcut starts Internet Explorer inside the VM. We’ll use this trick to pass Chrome.exe calls from the host system into the guest (VM) system with a .bat file and then making this .bat file the default browser program for the host system.

  1. First create a multilevel-security-browser.bat file by modifying these sources into some good location (I’ve placed it into F:\Users\Garo\VMLites\multilevel-security-browser.bat)
    @echo off
    pushd "C:\Program Files\VMLite\VMLite Workstation\"
    set path="C:\Program Files\VMLite\VMLite Workstation\";%path%
    vmlitectl run "VMLite XP Mode" "C:\Documents and Settings\Administrator\Local Settings\Application Data\Google\Chrome\Application\chrome.exe" "%*"
    popd

    Notice few things: The path line should have the VMLite installation directory inside the host system, the “VMLite XP Mode” should be the name of your VM and the chrome.exe path is the browser path inside the guest vm.

  2. Then create a multilevel-security-browser.reg file based on these sources:
    Windows Registry Editor Version 5.00
    
    [HKEY_CLASSES_ROOT\MultilevelSecurityBrowser]
    @="MultilevelSecurityBrowser"
    "URL Protocol"=""
    
    [HKEY_CLASSES_ROOT\MultilevelSecurityBrowser\DefaultIcon]
    @="C:\\Users\\garo\\AppData\\Local\\Google\\Chrome\\Application\\chrome.exe,0"
    
    [HKEY_CLASSES_ROOT\MultilevelSecurityBrowser\shell]
    
    [HKEY_CLASSES_ROOT\MultilevelSecurityBrowser\shell\open]
    
    [HKEY_CLASSES_ROOT\MultilevelSecurityBrowser\shell\open\command]
    @="\"f:\\Users\\garo\\VMLites\\multilevel-security-browser.bat\" -- \"%1\""
    
    [HKEY_CURRENT_USER\Software\Microsoft\Windows\Shell\Associations\UrlAssociations\http\UserChoice]
    "Progid"="MultilevelSecurityBrowser"

    and set the path for chrome.bat to the path where you created your multilevel-security-browser.bat. Notice that we use the chrome.exe as the source of our DefaultIcon which assumes that you have Chrome also installed into your host operating system.

  3. Save the multilevel-security-browser.reg file and click to Merge its contents with the Windows 7 registry. UAC will ask for a confirmation which you need to allow.
  4. We’re pretty much done here. You can now try to click some http url and if everything went correctly a black shell window will appear for a moment and the VM is started (if it isn’t already running) and the url should be opened inside Chrome in the guest vm.

I’ve used this setup only for a day now and so far it has worked nicely. the VMLite can be turned into Seamless mode and the Windows XP taskbar can be moved on the top of the screen and set it to Auto-Hide the taskbar.

Saunalahden mokkulan asennus OS X:ään, error 5370

Törmäsin asennusongelmiin Saunalahden mobiilitikun ohjelmiston kanssa yrittäiessäni asentaa sitä OS X:ään (10.6.5). Asennusohjelma ilmoitti virheen “An internal error has occured during configuration (5370)”.

Ongelma voidaan ratkaista seuraavasti:

  1. Avaa Pääte (Terminal)
  2. Kirjaudu superkäyttäjäksi komennolla sudo ja antamalla oma salasanasi.
  3. Siirry oikeaan hakemistoon komennolla: cd “/Applications/Elisa/Mobiililaajakaista opastettu asennus.app/Contents/MacOS” (huomaa lainausmerkit ja välilyönnit)
  4. Käynnistä asennusohjelma komennolla: ./MobileManager\ Setup\ Assistant

Asennusohjelman pitäisi tämän jälkeen suoriutua tehtävästään ongelmitta.

Crash course to Java JVM memory issues to sysadmins

Are you a sysadmin who is new to Java? Then you might find this post to be helpful.

Java has its own memory management system with garbage collection which is most of the time really nice, but you need to know some details how it works so you can administrate your JVM instances effectively.

How Java manages memory?

At the beginning Java JVM will allocate a block of memory from the OS to its heap which it will distribute to the program running inside the JVM. The amount is controlled with two command line arguments: -Xms tells how much memory JVM will allocate at the start and -Xmx what’s the maximum amount of memory which JVM can allocate from the OS. For example -Xms512m -Xmx1G will tell java to start with half gigabyte at the beginning and allow it to grow to one gigabyte.

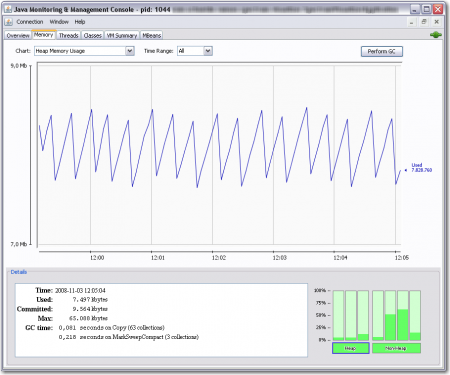
As the Java program runs it allocates memory for the objects from the JVM heap. This will result the heap to grow until a GC (garbage collection) threshold is  reached. This will trigger the JVM to see which objects are no longer used (objects which are not referenced by any working object) and it will free this memory back to the heap. There are numerous ways how this can work in different GC implementations (Java has many of them) and they’re out of the scope of this article. The main point is that the Java heap usage will grow until about 80% usage when the GC occurs and then drop back to much lower level. If you use jconsole to watch the free memory you will see something like this:

The saw tooth like pattern is just normal life Java garbage collection and nothing to worry about. This however will make it difficult to know how much memory the program actually uses needs.

What happens when Java runs out of memory?

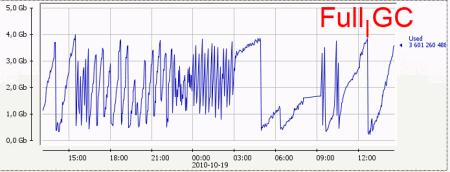
If JVM can’t free enough memory with a simple GC it will run a Full GC which will be a stop-the-world collection. This suspends the JVM execution until the collection is done.  A Full GC can be seen as a sudden drop on the amount of used memory, for example as seen in this image. The Full GC in this case took 0.8 seconds. It’s not much, but it did suspend the program execution for that time, so keep that in mind when designing your Java software and its real time requirements.

The Full GC will be able to free enough memory so that the program will continue, but if the JVM simply has not enough memory it will need to trigger another Full GC shortly. This can result in a GC storm where the program spends even more time doing even longer Full GC’s and finally running out of memory.  It’s not uncommon to see Full GC taking over two minutes in these situations and remember, the program is suspended during a Full GC! No need to say that this is bad, right?

However giving JVM too much memory is also bad. This will make the JVM happy as it doesn’t need to do Full GCs, but then the small GCs can take longer and if you eventually run into a Full GC situation it will take long. Very long. Thus you need to think how much memory your program will need and setup the JVM -Xms and -Xmx so that it has enough plus additional “gc breathing room” on top of that.

How the OS sees all this?

When the JVM starts and allocates the amount of memory specified in -Xms the OS will not immediately allocate all this memory but thanks to the modern virtual memory management the OS reserves this to be used later. You can see this in the VIRT column in top. Once the Java program starts to actually use this memory the OS will need to provide the memory and thus you can see the program RES column value to grow. VIRT means how much virtual memory has been allocated and mapped to the process (this includes the JVM heap memory plus JVM code and other libraries) and RES means how much memory from all VIRT memory is actually in the ram.

The Java in the image above has too big amount of memory. The program was started with 384MB heap (-Xms384m) but it was allowed to grow up to one gigabyte (-Xmx1G), but the program is actually using just 161 megabytes out of it.

However when the JVM GC runs and frees the memory back to the application, the memory is not given back to the OS. Thus you will see the RES value to grow up to VIRT, but never to actually decrease unless the OS chooses to swap some of the JVM memory out to disk. This can happen easily if you specify too big heap to the JVM which doesn’t get used and you should try to avoid this.

Top Tip for Top: You can press f to add and hide columns like SWAP. Notice that SWAP isn’t actually the amount of memory which has been swapped to disk. According to top manual: VIRT = SWAP + RES. Swap contains both the pages which has been swapped to disk and pages which hasn’t yet been actually used. See for more very usefull top commands by pressing ?.

How can I monitor all this?

The best way is to use JMX with some handy tool like jconsole. JConsole is a GUI utility which comes with all JDK distributions and can be found under the bin/ directory (jconsole.exe in windows). You can use the jconsole to connect into a running JVM and extract a lot of different metrics out of it and even tweak some settings on the fly.

JMX needs to be enabled, which can be done by adding these arguments to the JVM command line:

-Dcom.sun.management.jmxremote=true -Dcom.sun.management.jmxremote.port=8892 -Dcom.sun.management.jmxremote.ssl=false -Dcom.sun.management.jmxremote.authenticate=false -Dcom.sun.management.jmxremote=true

Notice that these settings disable authentication and ssl, so you should not do this unless your network is secured from the outside. You can also feed this data into monitor systems like Zabbix (my favourite), Cacti or Nagios, which I have found very helpful when debugging JVM performance.

Other way is to enable GC logging which can be done in Sun JVM with these command line parameters (these are reported to be working also with OpenJDK but I haven’t tested)

-XX:+PrintGCTimeStamps -XX:+PrintGC -Xloggc:/some/dir/cassandra.gc.log

These will print GC statistics to the log file, here’s an actual example:

17500.125: [GC 876226K->710063K(4193024K), 0.0195470 secs]
17569.086: [GC 877871K->711547K(4193024K), 0.0200440 secs]
17641.289: [GC 879355K->713210K(4193024K), 0.0201440 secs]
17712.079: [GC 881018K->714931K(4193024K), 0.0212350 secs]
17736.576: [GC 881557K->882170K(4193024K), 0.0419590 secs]
17736.620: [Full GC 882170K->231044K(4193024K), 0.8055450 secs]
17786.560: [GC 398852K->287047K(4193024K), 0.0244280 secs]

The first number is seconds since JVM startup, the second tells the GC type (normal vs. Full GC) and how much memory was freed.

Conclusion

  • Java JVM will eat all the memory which you give to it (this is normal)
  • You need to tune the JVM -Xms and -Xmx parameters to give it enough but not too much memory so your application works.
  • The memory wont be released back to the OS until JVM exists, but the OS can swap the JVM memory out. Usually this is bad and you need to decrease the memory you give to the JVM.
  • Use JMX to monitor the JVM memory usage to find suitable values.

Script and template to export data from haproxy to zabbix

I’ve just created a zabbix template with a script which can be used to feed performance data from haproxy to zabbix. The script firsts uses HTTP to get the /haproxy?stats;csv page, parses the CSV and uses zabbix_sender command line tool to send each attribute to the zabbix server. The script can be executed on any machine which can access both zabbix server and the haproxy stats page (I use the machine which runs the zabbix_server). The script and template works on both zabbix 1.6.x and 1.8.x.

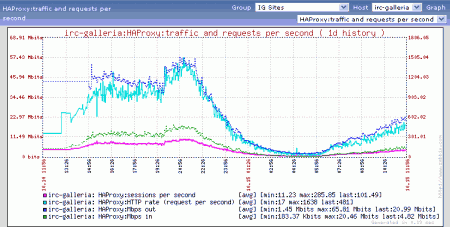
As the haproxy server names might differ from zabbix server names, the script uses annotations inside the haproxy.cfg hidden in comments. The annotations tell the script which frontend and server node statistics should be sent to the zabbix server. This allows you to keep the configuration in a central place which helps keeping the haproxy and zabbix configurations in sync. The template includes two graphs, example below:

I’ve chosen to export following attributes from haproxy, but more could be easily added (I accept patches via github.com):

  • Current session count
  • Maximum session count
  • Sessions per second
  • HTTP responses per minute, grouped by 1xx, 2xx, 3xx, 4xx and 5xx.
  • Mbps in (network traffic)
  • Mbps out (network traffic)
  • Request errors per minute
  • Connection errors per minute
  • Response errors per minute
  • Retries (warning) per minute
  • Rate (sessions per second)
  • HTTP Rate (requests per second)
  • Proxy name in haproxy config
  • Server name in haproxy config

The code is available at github: https://github.com/garo/zabbix_haproxy The script supports HTTP Basic Authentication and masking the HTTP Host-header.

Usage:

  1. Import the template_haproxyitems.xml into Zabbix.
  2. Add all your webservers to zabbix as hosts and link them with the Template_HAProxyItem
  3. Add all your frontends to zabbix as hosts and link them with the Template_HAProxyItem. The frontend hosts don’t need to be mapped to any actual ip nor server, I use the zabbix_server ip as the host ip for these.
  4. Edit your haproxy.cfg file and add annotations for the zabbix_haproxy script. These annotations mark which frontends and which servers you map into zabbix hosts. Notice that the annotations are just comments after #, so haproxy ignores them.
    frontend irc-galleria # @zabbix_frontend(irc-galleria)
            bind            212.226.93.89:80
            default_backend lighttpd
    
    backend lighttpd
            mode            http
            server  samba           10.0.0.1:80    check weight 16 maxconn 200   # @zabbix_server(samba.web.pri)
            server  bossanova       10.0.0.2:80    check weight 16 maxconn 200   # @zabbix_server(bossanova.web.pri)
            server  fuusio          10.0.0.3:80     check weight 4 maxconn 200   # @zabbix_server(fuusio.web.pri)
  5. Setup a crontab entry to execute the zabbix_haproxy script every minute.  I use the following entry in /etc/crontab:
    */1 * * * * nobody zabbix_haproxy -c /etc/haproxy.cfg -u "http://irc-galleria.net/haproxy?stats;csv" -C foo:bar -s [ip of my zabbix server]
  6. All set! Go and check the latests data in zabbix to see if you got the values. If you have problems you can use -v and -d command line arguments to print debugging information.

Oneliner: erase incorrect memcached keys on demand

We had a situation where our image thumbnail memcached cluster somehow got empty thumbnails. The thumbnails are generated on the fly by image proxy servers and the thumbnail is stored into memcached. For some reason some of the thumbnails were truncated.

As I didn’t have time to start debugging the real issue, I quickly wrote this oneliner which detects corrupted thumbnails when the thumbnail is fetched from the memcached and issues a delete operation to it. This will keep the situation under control until I can start the actual debugging. We could also have restarted the entire memcached cluster, but it would result in big preformance penalty for several hours. Fortunately all corrupted thumbnails are just one byte long, so detecting them was simple enough to do with an oneliner:

tcpdump -i lo -A -v -s 1400 src port  11213 |grep VALUE | perl -ne 'if (/VALUE (cach[^ ]+) [-]?\d+ (.+)/) { if ($2 == 1) { `echo "delete $1 noreply\n" | nc localhost 11213`; print "deleted $1\n"; } }'

Here’s how this works:

  1. tcpdump prints all packets in ascii (-A) which come from port 11213 (src port 11213), our memcached node,  from interface loopback (-i lo)
  2. the grep passes only those lines which contains the response header which has the following form: “VALUE <key> <flags> <length>
  3. for each line (-n) the perl executes the following script (-e ‘<script>’) which first uses regexp to catch the key “(cach[^ ]+)” and then the length.
  4. It then checks if the length is 1 if ($2 == 1) and on success it executes a shell command which sends a “delete <key> noreply” message to the memcached server using netcat (nc). This command will erase the corrupted value from memcached server.
  5. Last it prints a debug message

Open BigPipe javascript implementation

We have released our open BigPipe implementation written for IRC-Galleria which is implemented by loosely following this facebook blog. The sources are located at github: https://github.com/garo/bigpipe and there’s an example demonstrating the library in action at http://www.juhonkoti.net/bigpipe.

BigPipe allows speeding up page rendering times by loading the page in small parts called pagelets. This allows browser to start rendering the page while the php server is still processing to finish the rest. This transforms the traditional page rendering cycle into a streaming pipeline containing the following steps:

  1. Browser requests the page from server
  2. Server quickly renders a page skeleton containing the <head> tags and a body with empty div elements which act as containers to the pagelets. The HTTP connection to the browser stays open as the page is not yet finished.
  3. Browser will start downloading the bigpipe.js file and after that it’ll start rendering the page
  4. The PHP server process is still executing and its building each pagelet at a time. Once a pagelet  has been completed it’s results are sent to the browser inside a <script>BigPipe.onArrive(…)</script> tag.
  5. Browser injects the html code received into the correct place. If the pagelet needs any CSS resources those are also downloaded.
  6. After all pagelets have been received the browser starts to load all external javascript files needed by those pagelets.
  7. After javascripts are downloaded browser executes all inline javascripts.

There’s an usage example in example.php. Take a good look on it. The example uses a lot of whitespace padding to saturate web server and browser caches so that the bigpipe loading effect is clearly visible. Of course these paddings are not required in real usage. There’s still some optimizations to be done and the implementation is way from being perfect, but that hasn’t stopped us from using this in production.

Files included:

  • bigpipe.js Main javascript file
  • h_bigpipe.inc BigPipe class php file
  • h_pagelet.inc Pagelet class php file
  • example.php Example showing how to use bigpipe
  • test.js Support file for example
  • test2.js Support file for example
  • README
  • Browser.php Browser detection library by Chris Schuld (http://chrisschuld.com/)
  • prototype.js Prototypejs.org library
  • prototypepatch.js Patches for prototype

How NoSQL will meet RDBMS in the future

The NoSQL versus RDBMS war started a few years ago and as the new technologies are starting to get more mature it seems that the two different camps will be moving towards each other. Latests example can be found at http://blog.tapoueh.org/blog.dim.html#%20Synchronous%20Replication where the author talks about upcoming postgresql feature where the application developer can choose the service level and consistency of each call to give hint to the database cluster what it should do in case of database node failure.

The exact same technique is widely adopted in Cassandra where each operation has a consistency level attribute where the programmer can decide if he wants full consistency among entire cluster or is it acceptable if the result might not contain the most up to date data in case of node failure (and also gain extra speed for read operations) . This is also called Eventual Consistency.

The CAP theorem says that you can only have two out of three features from a distributed application: Consistency, Availability and Partition Tolerance (hence the acronym CAP). To give example: If you choose Consistency and Availability, your application cannot handle loss of a node from your cluster. If you choose Availability and Partition Tolerance, your application might not get most up-to-date data if some of your nodes are down. The third option is to choose Consistency and Partition Tolerance, but then your entire cluster will be down if you lost just one node.

Traditional relation databases are designed around the ACID principle which loosely maps to Consistency and Partition Tolerance in the CAP theorem. This makes it hard to scale an ACID into multiple hosts, because ACID needs Consistency. Cassandra in other hand can swim around the CAP theorem just fine because it allows the programmer to choose between Availability + Partition Tolerance  and Consistency + Availability.

In the other hand as nosql technology matures they will start to get features from traditional relation databases. Things like sequences, secondary indexes, views and triggers can already be found in some nosql products and many of them can be found from roadmaps. There’s also the ever growing need to mine the datastorage to extract business data out of it. Such features can be seen with Cassandra hadoop integration and MongoDB which has internal map-reduce implementation.

Definition of NoSQL: Scavenging the wreckage of alien civilizations, misunderstanding it, and trying to build new technologies on it.

As long as nosql is used wisely it will grow and get more mature, but using it without good reasons over RDBMS is a very easy way to shoot yourself in your foot. After all, it’s much easier to just get a single powerfull machine like EC2 x-large instance and run PostgreSQL in it, and maybe throw a few asynchronous replica to boost read queries. It will work just fine as long as the master node will keep up and it’ll be easier to program.


Good analysis paper over Stuxnet worm

The W32.Stuxnet worm has raised quite much discussion as its been analysed and technical details about its construction has been revealed. Stuxnet is special because it’s very complex and its targeted to attack very specific set of industrial process computers. These and other worm characteristics hints that the worm was created by a government  sponsored virus laboratory.

Some notable Stuxnet features include:

  • Four zero day exploits to windows operating system.
  • Stolen driver authentication certificates, including two from Realtek
  • Targeted to specific installation – it didn’t infect if it found to be in wrong computer.
  • Very installation specific payload which altered the process of the industrial control operations.

The following quote from [http://langner.com/en/] sums up all this pretty well:

The attack combines an awful lot of skills — just think about the multiple 0day vulnerabilities, the stolen certificates etc. This was assembled by a highly qualified team of experts, involving some with specific control system expertise. This is not some hacker sitting in the basement of his parents house. To me, it seems that the resources needed to stage this attack point to a nation state.

Read the full analysis paper at http://www.eset.com/resources/white-papers/Stuxnet_Under_the_Microscope.pdf

Also read the symantec blog at http://www.symantec.com/connect/blogs/exploring-stuxnet-s-plc-infection-process

Example how to model your data into nosql with cassandra

We have built a facebook style “messenger” into our web site which uses cassandra as storage backend. I’m describing the data schema to server as a simple example how cassandra (and nosql in general) can be used in practice.

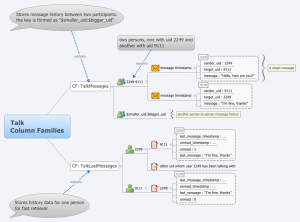
Here’s a diagram on the two column families and what kind of data they contain. Data is modelled into two different column families: TalkMessages and TalkLastMessages. Read more for deeper explanation what the fields are.

TalkMessages contains each message between two participants. The key is a string built from the two users uids “$smaller_uid:$bigger_uid”. Each column inside this CF contains a single message. The column name is the message timestamp in microseconds since epoch stored as LongType. The column value is a JSON encoded string containing following fields: sender_uid, target_uid, msg.

This results in following structure inside the column family.

"2249:9111" => [
  12345678 : { sender_uid : 2249, target_uid : 9111, msg : "Hello, how are you?" },
  12345679 : { sender_uid : 9111, target_uid : 2249, msg : "I'm fine, thanks" }
]

TalkLastMessages is used to quickly fetch users talk partners, the last message which was sent between the peers and other similar data. This allows us to quickly fetch all needed data which is needed to display a “main view” for all online friends with just one query to cassandra. This column family uses the user uid as its key. Each column
represents a talk partner whom the user has been talking to and it uses the talk partner uid as the column name. Column value is a json packed structure which contains following fields:

  • last message timestamp: microseconds since epoch when a message was last sent between these two users.
  • unread timestamp : microseconds since epoch when the first unread message was sent between these two users.
  • unread : counter how many unread messages there are.
  • last message : last message between these two users.

This results in following structure inside the column family for these
two example users: 2249 and 9111.

"2249" => [
  9111 : { last_message_timestamp : 12345679, unread_timestamp : 12345679, unread : 1, last_message: "I'm fine, thanks" }

],
"9111" => [
  2249 : { last_message_timestamp :  12345679, unread_timestamp : 12345679, unread : 0, last_message: "I'm fine, thanks" }
]

Displaying chat (this happends on every page load, needs to be fast)

  1. Fetch all columns from TalkLastMessages for the user

Display messages history between two participants:

  1. Fetch last n columns from TalkMessages for the relevant “$smaller_uid:$bigger_uid” row.

Mark all sent messages from another participant as read (when you read the messages)

  1. Get column $sender_uid from row $reader_uid from TalkLastMessages
  2. Update the JSON payload and insert the column back

Sending message involves the following operations:

  1. Insert new column to TalkMessages
  2. Fetch relevant column from TalkLastMessages from $target_uid row with $sender_uid column
  3. Update the column json payload and insert it back to TalkLastMessages
  4. Fetch relevant column from TalkLastMessages from $sender_uid row with $target_uid column
  5. Update the column json payload and insert it back to TalkLastMessages

There are also other operations and the actual payload is a bit more complex.

I’m happy to answer questions if somebody is interested :)

Cassandra operation success ratio survey results

It’s known that in Cassandra the compaction hurts the node performance so that the node might miss some requests. That’s why it’s important to handle these situations and the client needs to retry the operation into another working host. We have been storing performance data from each cassandra request which we do into our five node cassandra production cluster.

We log the retry count and request type into our data warehouse solution and I’ve now extracted the data from a 10 day period and calculated how many retry requests is needed so that the results can be obtained. The following chart tells how many time an operation had to be retried until it was successfully completed. The percents tells the probability like that “the request will be successful with the
first try in 99.933 % times.”

Total amount of operations: 94 682 251 within 10 days.

Retry times operations percentage from total operations
0 94618468 99.93263 %
1 56688 0.05987 %
2 5018 0.00529 %
3 1359 0.00144 %
4 111 0.00012 %
5 25 0.00003 %

There were also few operations which needed more than five retries, so preparing to try up to ten times is not a bad idea.

The cluster users 0.6.5 with RF=3. Dynamic Snitching was not enabled.  Each operation is executed until it succeeds or until 10 retries using this php wrapper http://github.com/dynamoid/cassandra-utilities

Hotswapping disks in OpenSolaris

Adding new SATA-disks to OpenSolaris is easy and it’s done with cfgadm command line util if the disk is in a normal ACHI SATA controller.  I have also an LSI SAS/SATA controller SAS3081E-R which uses its own utils. 

Hotpluging disk into normal ACHI SATA controller.

First add the new disk to the system and power it on (a good sata backplane is a must) and then type cfgadm to list all disks in the system:

garo@sonas:~# cfgadm
Ap_Id                          Type         Receptacle   Occupant     Condition
c3                             scsi-bus     connected    configured   unknown
pcie20                         unknown/hp   connected    configured   ok
sata4/0::dsk/c5t0d0            disk         connected    configured   ok
sata4/1                        disk         connected    unconfigured unknown
sata4/2                        sata-port    empty        unconfigured ok

This shows that disk sata4/1 is a new disk which have been added but is not yet configured. Type

garo@sonas:~# cfgadm -c configure sata4/1

Now the disks are configured. Typing cfgadm again shows that they have been configured as disks c5t0d0 and c5t1d0. They’re now ready to use in zpools.

Hotswapping disks in LSI SAS/SATA controller

I have also an LSI Logic SAS3081E-R 8-port (i:2xSFF8087) SAS PCI-e x4 SATA controller which can be used with Solaris default drivers, but it should be used with its own drivers (i used the Solaris 10 x86 drivers). After the drivers are installed you can use the lsiutil command line tool.

garo@sonas:~# lsiutil
LSI Logic MPT Configuration Utility, Version 1.61, September 18, 2008

1 MPT Port found

     Port Name         Chip Vendor/Type/Rev    MPT Rev  Firmware Rev  IOC
 1.  mpt0              LSI Logic SAS1068E B3     105      01170200     0

Select a device:  [1-1 or 0 to quit]

First select your controller (I have just one controller, so I’ll select 1). Then you can type 16 to Display attached devices, or 8 to scan for new devices. The driver will automaticly scan for new disks once a while (at least it seems so), so the disk might just pop up available to be used with zpool without you doing anything for it.

Main menu, select an option:  [1-99 or e/p/w or 0 to quit] 8

SAS1068E's links are 1.5 G, 1.5 G, 1.5 G, 1.5 G, 1.5 G, 1.5 G, 1.5 G, 1.5 G

 B___T___L  Type       Vendor   Product          Rev      SASAddress     PhyNum
 0   0   0  Disk       ATA      ST31000340AS     SD15  09221b066c554c66     5
 0   1   0  Disk       ATA      ST31000340AS     SD15  09221b066b7f676a     0
 0   2   0  Disk       ATA      ST31000340AS     SD15  09221b0669794a5d     1
 0   3   0  Disk       ATA      ST31000340AS     SD15  09221b066b7f4e6a     2
 0   4   0  Disk       ATA      ST31000340AS     SD15  09221b066b7f5b6d     3
 0   5   0  Disk       ATA      ST31000340AS     SD15  09221b066a6c6068     4
 0   6   0  Disk       ATA      ST3750330AS      SD15  0e221f04756c7148     6
 0   7   0  Disk       ATA      ST3750330AS      SD15  0e221f04758d7f40     7