Running Kubernetes at home for fun and profit.

Running a Kubernetes cluster at home might sound insane at first. However if you do have the habit to run some software on a few Raspberry Pi’s and you are already familiar with Docker you can see some clear benefits from transferring everything onto Kubernetes.

Kubernetes gives you a clear and uniform interface on how to run your workloads. You can easily see what you are running as you no longer can easily forget that you had a few scripts running somewhere. You can automate your backups, easily get strong authentication to your services you run and it can be really easy to install new software onto your cluster using helm.

This article doesn’t explain what Kubernetes is or how to deploy it as there are many tutorials and guides already in the Internet. Instead this article shows how does my setup looks and gives you ideas what you can do. I’m assuming that you already know Kubernetes on some level.

The building blocks: hardware.

I’m running Kubernetes in two machines: One is a small form factor Intel based PC with four cores and 16 GiB of ram and a SSD and the other is a HPE MicroServer with three spinning disks.

The small PC runs the Kubernetes control plane by itself. I installed a standard Ubuntu 18.04 LTS. I let the installer partition my disk using LVM and gave ~20 GiB for the root and left the rest ~200 GiB unallocated (I’ll come back later on this). After the installation I used kubeadm to install a single node control plane.

The MicroSever is a continuation of my previous story and its main thing is to run ZFS. It has three spinning disks in a triple mirrored configuration. Its main purpose is to consolidate and archive all the data for easy backups. When this project started I used kubeadm to install a worker node into this server and join it into the cluster.

The building blocks: storage.

Kubernetes can easily be used to run ephemeral workloads, but implementing a good persistent storage solution is not hard. I ended up with the following setup:

  • Let the PC SSD work also as a general purpose storage server.
  • Allocate the remaining disk from the LVM into a LV and create a zfs pool onto it.
  • Create a zfs filesystem onto this zpool (I call mine data/kubernetes-nfs)
  • Run the standard Linux kernel NFS server (configured via ZFS) to export this storage to the pods.
  • Use nfs-client-provisioner to create a StorageClass which automatically provisions PersistentVolume objects on new PersistentStorageClaim into this NFS storage.
  • Use sanoid to do hourly snapshots of this storage and stream the snapshots into the MicroServer as backups.

This setup gives enough fast storage for my requirements, is simple to maintain, is foolproof as the stored data is easily accessible just by navigating into the correct directory in the host and I can easily backup all of it using ZFS. Also if I need a big quantity of slower storage I can also nfs-mount storage from the MicroServer itself.

When I install new software to my cluster I just tell them to use the “nfs-ssd” StorageClass and everything else happens automatically. This is especially useful with helm as pretty much all helm charts support setting a storage class.

Other option could be to run ceph, but I didn’t have multiple suitable servers to run it and it is more complex than this setup. Also kubernetes-zfs-provisioner looked interesting but it didn’t feel mature enough at the time of writing this. Or if you know you will have just one server you can just use HostPaths to mount directories from your host into the pods.

The building blocks: networking.

I opted to run calico as it fits my purpose pretty well. I happen to have an Ubiquiti EdgeMax at my home so ended up setting Calico to bgp-peer with the EdgeMax to announce the pod ip address space. There are other options such as flannel. Kubernetes doesn’t really care what kind of network setup you have, so feel free to explore and pick what suits you best.

The building blocks: Single Sign On.

A very nice feature on Kubernetes is the Ingress objects. I personally like the ingress-nginx controller, which is really easy to setup and it also supports authentication. I paired this with the oauth2_proxy so that I can use Google accounts (or any other oauth2 provider) to implement a Single Sign On for any of my applications.

You will also want to have SSL encryption and using Lets Encrypt is a free way to do it. The cert-manager tool will handle cert generation with the Lets Encrypt servers. A highly recommended way is to own a domain and create a wildcard domain *.mydomain.com to point into your cluster public ip. In my case my EdgeMax has one public IP from my Internet provider and it will forward the TCP connections from :80 and :443 into two NodePorts which my ingress-nginx Service object exposes.

I feel that this is the best feature so far I have gotten from running Kubernetes. I can just deploy a new web application, set it to use a new Ingress object and I will automatically have the application available from anywhere in the world but protected with the strong Google authentication!

The oauth2_proxy itself is deployed with this manifest:

apiVersion: v1
kind: ConfigMap
metadata:
  name: sso-admins
  namespace: sso
data:
  emails.txt: |-
    my.email@gmail.com
    another.email@gmail.com

---

apiVersion: extensions/v1beta1
kind: Deployment
metadata:
  labels:
    k8s-app: oauth2-proxy-admins
  name: oauth2-proxy-admins
  namespace: sso
spec:
  replicas: 1
  selector:
    matchLabels:
      k8s-app: oauth2-proxy-admins
  template:
    metadata:
      labels:
        k8s-app: oauth2-proxy-admins
    spec:
      containers:
      - args:
        - --provider=google
        - --authenticated-emails-file=/data/emails.txt
        - --upstream=file:///dev/null
        - --http-address=0.0.0.0:4180
        - --whitelist-domain=.mydomain.com
        - --cookie-domain=.mydomain.com
        - --set-xauthrequest
        env:
        - name: OAUTH2_PROXY_CLIENT_ID
          value: "something.apps.googleusercontent.com"
        - name: OAUTH2_PROXY_CLIENT_SECRET
          value: "something"
        # docker run -ti --rm python:3-alpine python -c 'import secrets,base64; print(base64.b64encode(base64.b64encode(secrets.token_bytes(16))));'
        - name: OAUTH2_PROXY_COOKIE_SECRET
          value: somethingelse
        image: quay.io/pusher/oauth2_proxy
        imagePullPolicy: IfNotPresent
        name: oauth2-proxy
        ports:
        - containerPort: 4180
          protocol: TCP
        volumeMounts:
        - name: authenticated-emails
          mountPath: /data
      volumes:
        - name: authenticated-emails
          configMap:
            name: sso-admins

---

apiVersion: v1
kind: Service
metadata:
  labels:
    k8s-app: oauth2-proxy-admins
  name: oauth2-proxy-admins
  namespace: sso
spec:
  ports:
  - name: http
    port: 4180
    protocol: TCP
    targetPort: 4180
  selector:
    k8s-app: oauth2-proxy-admins

---

apiVersion: extensions/v1beta1
kind: Ingress
metadata:
  name: oauth2-proxy-admins
  namespace: sso
spec:
  rules:
  - host: sso.mydomain.com
    http:
      paths:
      - backend:
          serviceName: oauth2-proxy-admins
          servicePort: 4180
        path: /oauth2
  tls:
  - hosts:
    - sso.mydomain.com
    secretName: sso-mydomain-com-tls

If you have different groups of users in your cluster and want to limit different applications to have different users you can just duplicate this manifest and have different user list in the ConfigMap object.

Now when you want to run a new application you expose it with this kind of Ingress:

apiVersion: extensions/v1beta1
kind: Ingress
metadata:
  annotations:
    kubernetes.io/ingress.class: nginx
    kubernetes.io/tls-acme: "true"
    nginx.ingress.kubernetes.io/auth-signin: https://sso.mydomain.com/oauth2/start?rd=https://$host$request_uri
    nginx.ingress.kubernetes.io/auth-url: https://sso.mydomain.com/oauth2/auth
  labels:
    app: myapp 
  name: myapp 
  namespace: myapp 
spec:
  rules:
  - host: myapp.mydomain.com
    http:
      paths:
      - backend:
          serviceName: myapp
          servicePort: http
        path: /
  tls:
  - hosts:
    - myapp.mydomain.com
    secretName: myapp-mydomain-com-tls

And behold! When you nagivate to myapp.mydomain.com you are asked to login with your Google account.

The building blocks: basic software.

There are some highly recommended software you should be running in your cluster:

  • Kubernetes Dashboard, a web based UI for your cluster.
  • Prometheus for collecting metrics from your cluster. I recommend to use the prometheus-operator to install it. It will also install Grafana so that you can easily build dashboards for the data.

The building blocks: Continuous deployment with Gitlab.

If you ever develop any own software I can highly recommend Gitlab.com as gives you free private git repositories, has a built-in deployment pipeline and private Docker Registry for your own applications.

If you expose your Kubernetes api server to public internet (I use NAT to map port 6445 from my public ip into the Kubernetes apiserver) you can let Gitlab to run your own builds in your own cluster, making your builds much faster.

I created a new Gitlab Group where I configured my cluster so that all projects within that group can easily access the cluster. I then use the .gitlab-ci.yml to both build a new Docker Image from my project and deploy it into my cluster. Here’s an example project showing all that. With this setup I can write a new project from a simple template and have it running in my cluster in less than 15 minutes.

You can also run Visual Studio Code (VS Code) in your cluster so that you can have a full featured programming editor in your browser. See https://github.com/cdr/code-server for more information. When you bundle this with the SSO you can be fully productive with any computer assuming it has a web browser.

What next?

If you reached this far you should be pretty comfortable with using Kubernetes. Installing new software easy as you often find out there’s an existing Helm chart available. I personally run also these software in my cluster:

  • Zoneminder (a ip security camera software).
  • tftp server to backup my switch and edgemax configurations.
  • Ubiquiti Unifi controller to manage my wifi.
  • InfluxDB to store measurements from my IOT devices.
  • MQTT broker.
  • Bunch of small microservices I built by myself in my IOT projects.

Problems With Node.JS Event Loop

Asynchronous programming with Node.JS is easy after getting used to it but the single threaded model on how Node.JS works internally hides some critical issues. This post explains what everybody should understand on how the Node.JS event loop works and what kind of issues it can create, especially on high transactional volume applications.

What The Event Loop Is?

In the central of Node.JS process sits a relatively simple concept: an event loop. It can be thought as a never ending loop which waits for external events to happen and it then dispatches these events to application code by calling different functions which the node.js programmer created. If we think this really simple node.js program:

setTimeout(function printHello () {
    console.log("Hello, World!");
}, 1000);

When this program is executed the setTimeout function is called immediately. It will register a timer into the event loop which will fire after one second. After the setTimeout call the program execution freezes: the node.js event loop will patiently wait until one second has elapsed and it then executes the printHello() function, which will print “Hello World!”. After this the event loop notices that there’s nothing else to be done (no events to be scheduled and no I/O operations underway) and it exists the program.

We can draw this sequence like this where time flows from left to right: The red boxes are user programmable functions. In between there’s the one second delay where the event loop sits waiting and until it eventually executes the printHello function.

Let’s have another example: a simple program which does a database lookup:

var redis = require('redis'), client = redis.createClient();
client.get("mykey", function printResponse(err, reply) {
    console.log(reply);
});

If we look closely on what happens during the client.get call:

  1. client.get() is called by programmer
  2. the Redis client constructs a TCP message which asks the Redis server for the requested value.
  3. A TCP packet containing the request is sent to the Redis server. At this point the user program code execution yields and the Node.JS event loop will place a reminder that it needs to wait for the network packet where the Redis server response is.
  4. When the message is receivered from the network stack the event loop will call a function inside the Redis client with the message as the argument
  5. The Redis client does some internal processing and then calls our callback, the printResponse() function.

We can draw this sequence on a bit higher level like this: the red boxes are again user code and then the green box is a pending network operation. As the time flows from left to right the image represents the delay where the Node.JS process needs to wait for the database to respond over network.

Handling Concurrent Requests

Now when we have a bit of theory behind us lets discuss a bit more practical example: A simple Node.JS server receiving HTTP requests, doing a simple call to redis and then return the answer from redis to the http client.

var redis = require("redis"), client = redis.createClient();
var http = require('http');

function handler(req, res) {
	redis.get('mykey', function redisReply(err, reply) {
	  res.end("Redis value: " + reply)
	});
}

var server = http.createServer(handler);
server.listen(8080);

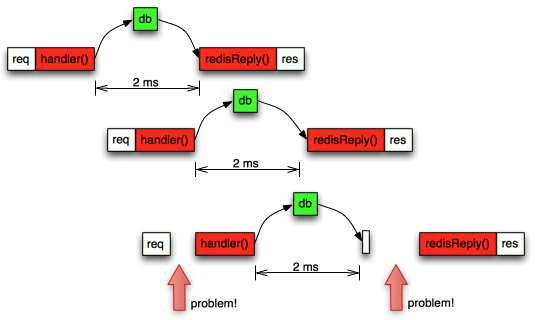
Let’s look again an image displaying this sequence. The white boxes represent incoming HTTP request from a client and the response back to that client.

So pretty simple. The event loop receives the incoming http request and it calls the http handler immediately. Later it will also receive the network response from redis and immediately call the redisReply() function. Now lets examine a situation where the server receives little traffic, say a few request every few second:

In this sequence diagram we have the first request on “first row” and then the second request later but drawn on “second row” to represent the fact that these are two different http request coming from two different clients. They are both executed by the same Node.JS process and thus inside the same event loop. This is the key thing: Each individual request can be imagined as its own flow of different javascript callbacks executed one after another but they are all actually executing in the same process. Again because Node.JS is single threaded then only one javascript function can be executing simultaneously.

Now The Problems Start To Accumulate

Now as we are familiar with the sequence diagrams and the notation I’ve used to draw how different requests are handled in a single timeline we can start going over different scenarios how the single threaded event loop creates different problems:

What happens if your server gets a lot of requests? Say 1000 requests per second? If each request to the redis server takes 2 milliseconds and as all other processing is minimal (we are just sending the redis reply straight to the client with a simple text message along it) the event loop timeline can look something like this:

Now you can see that the 3rd request can’t start its handler() function right away because the handler() on the 2nd request was still executing. Later the redis reponse from the 3rd arrived after 2ms to the event loop, but the event loop was still busy executing the redisReply() function from the 2nd request. All this means that the total time from start to finish on the 3rd request will be slower and the overall performance of the server starts to degrade.

To understand the implications we need to measure the duration of each request from start to finish with code like this:

function handler(req, res) {
        var start = new Date().getTime();
	redis.get('mykey', function redisReply(err, reply) {
	  res.end("Redis value: " + reply);
          var end = new Date().getTime();
          console.log(end-start);
	});
}

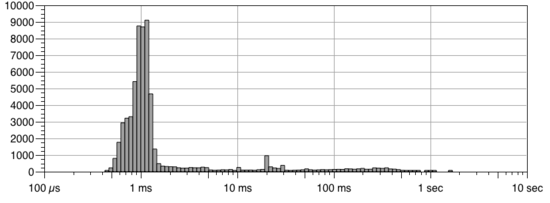
If we analyse all durations and then calculate how long an average request takes we might get something like 3ms. However an average is a really bad metric because it hides the worst user experience. A percentile is a measure used in statistics indicating the value below which a given percentage of observations in a group of observations fall. For example, the 20th percentile is the value (or score) below which 20 percent of the observations may be found. If we instead calculate median (which means 50%), 95% and 99% percentile values we can get much better understanding:

  • Average: 3ms
  • Median: 2ms
  • 95 percentile: 10ms
  • 99 percentile: 50ms

This shows the scary truth much better: for 1% of our users the request latency is 50 milliseconds, 16 times longer than average! If we draw this into graph we can see why this is also called a long tail: On the X-axis we have the latency and on the Y axis we have how many requests were completed in that particular time.

So the more requests per second our server servers, the more probability that a new request arrives before the previous is completed rises and thus the probability that the request is blocked due to other requests increases. In practice, with node.js when the server CPU usage grows over 60% then the 95% and 99% latencies start to increase quickly and thus we are forced to run the servers way below their maximum capacity if we want to keep our SLAs under control.

Problems With Different End Users

Let’s play with another scenario: Your website servers different users. Some users visit the site just few times a month, most visit once per day and then there are a small group of power users, visiting the site several times per hour. Lets say that when you process a request for a single user you need to fetch the history when the user visited your site during the past two weeks. You then iterate over the results to calculate whatever you wanted, so the code might look something like this:

function handleRequest(res, res) {
	db.query("SELECT timestamp, action from HISTORY where uid = ?", [request.uid], function reply(err, res) {
	  for (var i = 0; i < res.length; i++) {
	  	processAction(res[i]);
	  }
	  res.end("...");
	})
}

A sequence diagram would look pretty simple:

For the majority of the sites users this works really fast as a average user might visit your site 20 times within the past two weeks. Now what happens a heavy user hits your site which has visited the site 2000 times the past two weeks? The for loop needs to go over 2000 results instead of just a handful and this might take a while:

As we can see this immediately causes delays not only to the power user but all other users which had the back luck of browsing the site at the same time when a power user request was underway. We can mitigate this by using process.nextTick to process a few rows at a time and then yield. The code could look something like this:

var rows = ['a', 'b', 'c', 'd', 'e', 'f'];

function end() {
	console.log("All done");
}

function next(rows, i) {
	var row = rows[i];
	console.log("item at " + i + " is " + row)
	// do some processing
	if (i > 0) {
	    process.nextTick(function() {
            next(rows, i - 1);
	    });
	} else {
	    end();
	}
}

next(rows, rows.length - 1);

The functional code adds complexity but the time line looks now more favourable for long processing:

It’s also worth noting that if you try to fetch the entire history instead of just two weeks, you will end up with a system which performs quite well at the start but will gradually getting slower and slower.

Problems Measuring Internal Latencies

Lets say that during a single request your program needs to connect into a redis database and a mongodb database and that we want to measure how long each database call takes so that we can know if one of our databases is acting slowly. The code might look something like this (note that we are using the handy async package, you should check it out if you already haven’t):

function handler(req, res) {
	var start = new Date().getTime();
	async.series([
		function queryRedis(cb) {
			var rstart = new Date().getTime();
			redis.get("somekey", function endRedis(err, res) {
				var rend = new Date().getTime();
				console.log("redis took:", (rend - rstart));
				cb(null, res);
			})
		},
		function queryMongodb(cb) {
			var mstart = new Date().getTime();
			mongo.query({_id:req.id}, function endMongo(err, res) {
				var mend = new Date().getTime();
				console.log("mongodb took:", (mend - mstart));
				cb(null, res);
			})
		}
	], function(err, results) {
		var end = new Date().getTime();
		res.end("entire request took: ", (end - start));
	})
}

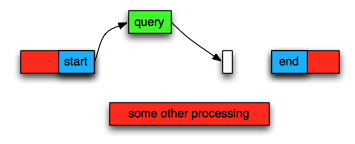
So now we track three different timers: one for each database call duration and a 3rd for the entire request. The problem with this kind of calculation is that they are depended that the event loop is not busy and that it can execute the endRedis and endMongo functions as soon as the network response has been received. If the process is instead busy we can’t any more measure how long the database query took because the end time measurement is delayed:

As we can see the time between start and end measurements were affected due to some other processing happening at the same time. In practice when you are affected by a busy event loop all your measurements like this will show highly elevated latencies and you can’t trust them to measure the actual external databases.

Measuring Event Loop Latency

Unfortunately there isn’t much visibility into the Node.JS event loop and we have to resort into some clever tricks. One pretty good way is to use a regularly scheduled timer: If we log start time, schedule a timer 200ms into the future (setTimeout()), log the time and then compare if the timer was fired more than 200 ms, we know that the event loop was somewhat busy around the 200ms mark when our own timer should have been executed:

var previous = null;
var profileEventLoop = function() {
    var ts = new Date().getTime();
    if (previous) {
    	console.log(ts - previous);
    }
    previous = ts;

	setTimeout(profileEventLoop, 1000);
}

setImmediate(profileEventLoop);

On an idle process the profileEventLoop function should print times like 200-203 milliseconds. If the delays start to get over 20% longer than what the setTimeout was set then you know that the event loop starts to get too full.

Use Statsd / Graphite To Collect Measurements

I’ve used console.log to print out the measurement for the sake of simplicity but in reality you should use for example statsd + graphite combination. The idea is that you can send a single measurement with a simple function call in your code to statsd, which calculates multiple metrics on the received data every 10 seconds (default) and it then forwards the results to Graphite. Graphite can then used to draw different graphs and further analyse the collected metrics. For example actual source code could look something like this:

var SDC = require('statsd-client'), sdc = new SDC({host: 'statsd.example.com'});

function handler(req, res) {
    sdc.increment("handler.requests")K
    var start = new Date();
    redis.get('mykey', function redisReply(err, reply) {
        res.end("Redis value: " + reply);
        sdc.timer("handler.timer", start);
    });
}

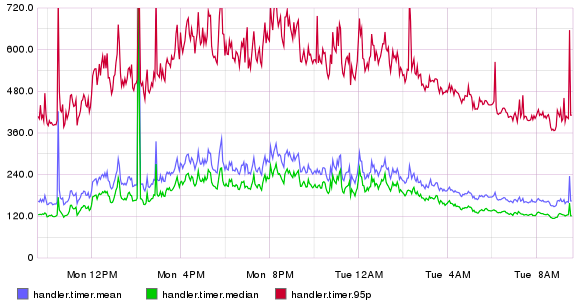
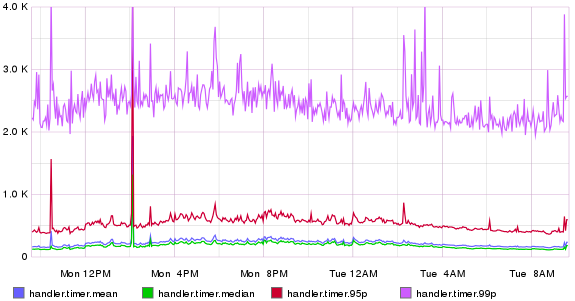
Here we increment a counter handler.requests each time we get a new incoming request. This can be then used to see how many requests per second the server is doing during a day. In addition we measure how long the total request took to process. Here’s an example what the results might look when the increasing load starts to slow the system and the latency starts to spike up. The blue (mean) and green (median) latencies are pretty tolerable, but the 95% starts to increase a lot, thus 5% of our users get a lot slower responses.

If we add the 99% percentile to the picture we see how bad the situation can really be:

Conclusion

Node.JS is not an optimal platform to do complex request processing where different requests might contain different amount of data, especially if we want to guarantee some kind of Service Level Agreement (SLA) that the service must be fast enough. A lot of care must be taken so that a single asynchronous callback can’t do processing for too long and it might be viable to explore other languages which are not completely single threaded.

Snapshot recovery problems with MongoDB, mmap, XFS filesystem and rsync

I’m running a MongoDB 2.2 cluster in Amazon EC2 consisting of three machines. One of these machines is used to take hourly snapshots with LVM and EBS and I noticed a rare bug which leads to silent data corruption on the restore phase. I’m using Rightscale to configure the machines with my own ServerTemplate, which I enhance with some Rightscale Chef recipes for automated snapshots and restore. Rightscale needs to support multiple different platforms, where AWS is just one of them and they have carefully constructed these steps to perform the snapshot.

Each machine has two provisioned IO EBS volumes attached to the machine. The Rightscale block_device::setup_block_device creates an LVM volume group on top of these raw devices. Because EC2 can’t do atomic snapshot over multiple EBS volumes simultaneously, the LVM snapshots is used for this. So the backup steps are:

  1. Lock MongoDB from writes and flush journal file to disk to form a checkpoint with the db.fsyncLock() command.
  2. Lock the underlying XFS filesystem
  3. Do LVM snapshot
  4. Unlock XFS filesystem
  5. Unlock MongoDB with db.fsyncUnlock()
  6. Perform EBS snapshot for each underlying EBS volumes
  7. Delte the LVM snapshot, so that it doesn’t take disk space.

Notice that the main volume will start getting writes after step 5, before the EBS volumes have been snapshotted by Amazon EC2. This point is crucial when understanting the bug later. The restore procedure does the following steps in the block_device::do_primary_restore Chef recipe:

  1. Order EC2 to create new EBS volumes from each EBS snapshots and wait until the api says that the volumes have attached correctly
  2. Spin up the LVM
  3. Mount the snapshot first in read-write so that XFS can unroll the journal log and then remount it into read-only mode
  4. Mount the main data volume
  5. Use rsync to sync from the snapshot into the main data volume:  rsync -av –delete –inplace –no-whole-file /mnt/snapshot /mnt/storage
  6. Delete the LVM snapshot

Actual bug

MongoDB used mmap() sys-call to memory-map the data files from disk to memory. This makes the file layer implementation easier, but it creates other problems. Biggest issue is that the MongoDB daemon can’t know when the kernel flushes the writes to disk. This is also crucial information needed to understand this bug.

Rsync is very smart to optimize the comparison  and the sync. By default, rsync first looks at the file last modification time and size to determine if the file has changed. Only after it starts a sophisticated comparison function which sends the changed data over network. This makes it very fast to operate.

Now the devil of this bug comes from the kernel itself. It turns out that the kernel has a long lasting bug (dating way back to 2004!) where in some cases the mmap()’ed file mtime (last modification time) is not updated on sync when the kernel flushes writes to the disk, which uses XFS filesystem. Because of this, some of the data which mongodb writes after the LVM snapshot and before the EBS snapshot to the memory-map’ed data is flushed to the disk, but the file mtime is not updated.

Because the Rightscale restoration procedure uses rsync to sync the inconsistent main data volume from the consistent snapshot, the rsync will not notice that some of these files have been changed. Because of this, rsync in fact does not do a proper job to reconstruct the data volume and this results corrupted data.

When you try to start MongoDB from this kind of corrupted data, you will encounter some weird assertion errors like these:

Assertion: 10334:Invalid BSONObj size: -286331154 (0xEEEEEEEE) first element

and

ERROR: writer worker caught exception: BSONElement: bad type 72 on:

I first though that this was a bug in the MongoDB journal playback. The guys at 10gen were happy to assist me and after more careful digging I started to be more suspicious on the snapshot method itself. This required a quite lot of detective work by trial and error until I finally started to suspect the rsync phase in the restoration.

The kernel bug thread had a link to this program which replicated the actual bug in Linux and this confirmed that my system was still suffering from this very same bug:

[root@ip-10-78-10-22 tmp]# uname -a

Linux ip-10-78-10-22 2.6.18-308.16.1.el5.centos.plusxen #1 SMP Tue Oct 2
23:25:27 EDT 2012 x86_64 x86_64 x86_64 GNU/Linux

[root@ip-10-78-10-22 tmp]# dd if=/dev/urandom of=/mnt/storage/foo.txt
20595+0 records in
20594+0 records out
10544128 bytes (11 MB) copied, 1.75957 seconds, 6.0 MB/s

[root@ip-10-78-10-22 tmp]# /tmp/mmap-test /mnt/storage/foo.txt
Modifying /mnt/storage/foo.txt...
Flushing data using sync()...
Failure: time not changed.
Not modifying /mnt/storage/foo.txt...
Flushing data using msync()...
Success: time not changed.
Not modifying /mnt/storage/foo.txt...
Flushing data using fsync()...
Success: time not changed.
Modifying /mnt/storage/foo.txt...
Flushing data using msync()...
Failure: time not changed.
Modifying /mnt/storage/foo.txt...
Flushing data using fsync()...
Failure: time not changed.

Conclusions

I’m now working with both Rightscale and 10gen so that others won’t suffer from this bug. Mainly this means a few documentation tweaks on 10gen side and maybe a change of the backup procedurals on Rightscale side. Note that this bug does not happen unless you are snapshotting a database which uses mmap(). This means that at least MySQL and PostgreSQL are not affected.

This issue reminds that you should periodically test your backup methods by doing a restore and comparing that your data is intact. Debugging this strange bug took me for about a week. It contained all the classic pieces of a good detective story: false leads, dead ends, a sudden plot twist and a happy ending :)

Change terminal title in os x

If you’re like me, you’ll have a terminal with dozen or so tabs open and you can’t remember which tab was which. The problem is even more annoying when you have some programs running on each tab and you can’t differentiate them.

By adding this oneliner to your ~/.bash_profile you can set the title for your terminal:

function title() { echo -n -e "\033]0;$@\007"; }

Just type “title something” and the title will change. Note that you need to apply the file by typing “. ~/.bash_profile” or by reopening the tab.

Kindlen käyttö Suomessa

Kindle on Amazonin erinomainen sähköisten kirjojen lukulaite, jonka saa tilattua Suomeen Amazonin verkkokaupasta reilun sadan euron hintaan. Jenkkimatkalla Kindlen voi noutaa itselleen noin 70 euron hintaan. Kindle käyttää ns. sähköistä mustetta (eInk), jonka lukeminen vastaa erittäin hyvin paperilta lukemista. Koska näytössä ei ole taustavaloa, sen lukeminen ei rasita silmiä ja sen käyttö vie erittäin vähän sähköä. Kindlen akku kestääkin normaalissa käytössä helposti kuukauden. Kindlen kaveriksi kannattaa ostaa jonkinlainen suojakuori, jotta sen kantaminen mukana olisi huolettomampaa. Kindle ladataan kytkemällä se micro-USB -johdolla esimerkiksi tietokoneeseen.

Kindlessä on sisäänrakennettuna Englannin, Ranskan, Saksan, Italian, Portugalin ja Espanjan tietosanakirjat. Voit erittäin helposti tarkistaa lähes minkä tahansa sanan merkityksen lukiessasi mitä tahansa kirjaa. Tämä on erittäin kätevä, jos esimerkiksi jokin Englanninkielisen romaanin sana ei ole ennalta tuttu. Vaikka pidänkin Englannin kielen sanavarastoani kohtuullisena, tämä ominaisuus on ollut ahkerassa käytössä. Sanan hakeminen tapahtuu liikuttamalla kursori halutun sanan eteen, jolloin sanan selostus ilmestyy ruudun reunaan.

Näyttö on mustavalkoinen ja se sopii parhaiten romaanien lukemiseen. Muita sovelluskohteita on esimerkiksi tietokirjat, oppikirjat ja laitteiden manuaalit. Grafiikkaa sisältävät julkaisut ja sarjakuvat eivät ole Kindlen omininta aluetta. Kindlestä on saatavilla useita eri malleja: Näppäimistöllä tai ilman, kosketusnäytöllä tai ilman, 3G yhteydellä tai ilman. Itse olen ollut hyvin tyytyväinen kaikista halvimpaan malliin, jossa ei ole mitään edellämainituista.

  • Näppäimistö: Kindlen avulla voi tehdä muistiinpanoja, merkintöjä “sivujen marginaaleihin” ja hakea tekstiä kirjasta ja selata vaikka Wikipediaa. Kaikki onnistuu tarvittaessa myös näytöltä käytettävällä näppäimistöllä. Koska itse käytän Kindleä vain lukemiseen, en ole kaivannut fyysistä näppäimistöä.
  • Kosketusnäyttö: Helpottaa esimerkiksi on-screen -näppäimistön käyttöä, mutta toisaalta täyttää näytön sormenjäljillä. En ole kaivannut.
  • 3G-yhteys: Kindlen saa (lähes) ilmaiseksi ympäri maailman toimivalla 3G yhteydellä. Kindlen avulla voi ostaa kirjoja suoraan Amazonin verkkokaupasta, eikä näiden lataamisesta Kindleen tarvitse maksaa tiedonsiirtomaksua. Ainoastaan omien dokumenttien lataaminen sähköpostin välityksellä maksaa jonkin verran. Jos sinulla on mahdollisuus käyttää WLANia esimerkiksi puhelimen kautta, et tarvitse tätä.
  • Mainokset: Jenkeistä ostamalla voi valita muutaman kymmenen dollarin halvemman version, joka näyttää laitteen ollessa poiskytkettynä jonkin satunnaisen mainoksen. Mainokset eivät haittaa lukemista, eikä niiden käyttö vähennä laitteen akunkestoa. Itse en ole kokenut mainoksia häiritseväksi ja ne sisältävät satunnaisesti ihan hyviä tarjouksia.
  • DX-versio: Kindlestä on olemassa myös huomattavasti isompi DX versio. Itse en ole tätä kaivannut, vaan romaanien lukeminen onnistuu hyvin normaalin Kindlen näytöltä. Voisin kuvitella, että isommasta näytöstä olisi hyötyä esimerkiksi PDF-muodossa olevien manuaalien lukemisessa.

Kindle tukee natiivisti Amazonin omaa .AWZ-formaattia, yleisesti käytettävää .MOBI-formaattia, PDF- ja TXT-tiedostoja. Netissä on saatavilla runsaasti .EPUB-tiedostoja, jotka on muunnettava Kindlen ymmärtämään muotoon esimerkiksi Calibre-ohjelmistolla.

Kindleen voi hankkia lukemista seuraavilla eri tavoilla, järjestettynä parhaimmasta tavasta huonompaan:

  • Osto Amazonin verkkokaupasta: Tämä on ehdottomasti Kindlen paras ominaisuus. Kirjauduttasi sisään Amazoniin, voit ladata lähes minkä tahansa kirjan Kindleen painamalla oikeasta reunasta “Buy now with 1-Click.” Tämän jälkeen sinun tarvitsee ainoastaan kytkeä Kindlen WLAN päälle. Parhaassa tapauksessa kirja on luettavissa viiden sekunnin päästä napin klikkauksesta. Ostokokemus on täysin omaa luokkaansa ja suorastaan häkellyttävän helppoa.
  • Ilmaisten netistä saatavien kirjojen lataaminen omalta koneelta käyttämällä Calibre-ohjelmistoa. Calibren avulla voit muuntaa lähes minkä tahansa kirjan Kindlen osaamaan .mobi-tiedostomuotoon. Kytket vain Kindlen USB:llä tietokoneeseesi ja valitset mitkä kirjat haluat ladata Kindleen.
  • Kirjan lähettäminen sähköpostin liitetiedostona <oma tunnus>@kindle.com -osoitteeseen. Voit laittaa esimerkiksi .MOBI-tiedoston sähköpostin liitteeksi, jolloin se päätyy sinulle Kindleen luettavaksi muutamassa minuutissa.
  • PDF tiedostojen lataaminen USB:llä. Voit kopioida PDF tiedostot sellaisenaan Kindleen kytkemällä sen USB:llä tietokoneeseen ilman Calibrea. PDF tiedostojen lukeminen ei ole niin mukavaa kuin Kindlelle taitetun kirjan, mutta se soveltuu silti kohtalaisesti esimerkiksi manuaalien lukemiseen.
  • Kirjojen osto Suomalaisista verkkokaupoista. Suomalaiset verkkokaupat eivät ole kovinkaan fiksuja, koska kaikki myydyt kirjat ovat DRM suojattuja. Tämän takia sinun tulee murtaa ostetun kirjan DRM suojaus käyttäen Calibrea. Tämä on täysin mahdollista ja hyvin helppoa, mutta kuvastaa silti täydellistä ymmärtämättömyyttä eBook markkinoista. Tämän jälkeen ei tarvitse ihmetellä miksi Suomalaiset kirjakaupat valittavat huonosta eBook-myynnistä.

Ilmaisia klassikkokirjoja löytää mm. Project Gutenberg:n sivuilta ja hakemalla Googlesta “ebook”, “.mobi” ja “.epub” -hakusanoilla. Valitettavasti jotkut verkkokaupat myyvät näitä ilmaiseksi saatavia kirjoja muutaman dollarin hinnalla, joten kannattaa varoa ettei maksa turhasta.

Hotswapping disk in OpenSolaris ZFS with LSI SATA card

One of my disks in a raidz2 array crashed a few days ago and it was time to hotswap a disk. zpool status showed a faulted drive:

raidz2    DEGRADED     0     0     0
  c3t6d0  ONLINE       0     0     0
  c3t7d0  FAULTED     27 85.2K     0  too many errors
  c5t0d0  ONLINE       0     0     0
  c5t1d0  ONLINE       0     0     0

The disk is attached into an LSI Logic SAS1068E B3 SATA card which has eight SATA ports. I used lsiutil to find out that there were indeed some serious problems with the disk:

Adapter Phy 7:  Link Up
  Invalid DWord Count                                     306,006
  Running Disparity Error Count                           309,292
  Loss of DWord Synch Count                                     0
  Phy Reset Problem Count                                       0

I’m not sure what “Invalid DWord Count” and “Running Disparity Error Countmeans, but that indeed doesn’t look good. I guess I need to do some googling after this. zpool status showed problems with disk c3t7d0 which is mapped into the 8th disk in the LSI card.

I replaced the old disk and added the new disk into the system on the fly. The LSI card noticed and initialized the disk, but with a different id. The disk is now c3t8d0. This is propably because the disk wasn’t the same. I ordered zfs to replace the old disk with the new one with command “zpool replace tank c3t7d0 c3t8d0

raidz2       DEGRADED     0     0     0
  c3t6d0     ONLINE       0     0     0  14.2M resilvered
  replacing  DEGRADED     0     0     0
    c3t7d0   FAULTED     27 89.2K     0  too many errors
    c3t8d0   ONLINE       0     0     0  2.03G resilvered
  c5t0d0     ONLINE       0     0     0  14.2M resilvered
  c5t1d0     ONLINE       0     0     0  13.5M resilvered

That’s it. The resilver took me 3h16m to complete.

What are the odds?

You all know this: You learn something new like a new word and then the next day you’ll stumble across this new thing you have just learned in a newspaper. Most of this can be easily explained with some brain pattern matching: you have previously come across this word many times but because you didn’t know it’s meaning you could not remember those cases, but after you learned it you’ll brain is programmed to search for those new words or things and you’ll remember your learning experience.

Yesterday I was going to my parents place and my dad picked me up from the train station and he was listening to Car Talk and he explained what the program was all about. I’m pretty sure I haven’t never listened that radio show before but I learned the concept and thinked that I wouldn’t listened that show again for a long time, mainly because I just don’t listen to radio.

And the next day I on my comic strip learning moment with my morning coffee I read todays XKCD (I read xkcd every day) strip:

Now Randall Munroe please explain this!

Kysymyksiä ja vastauksia NASini toiminnasta.

Olen keskustellut NAS projektistani muropaketissa, jossa esitettiin lukuisia kysymyksiä projektistani:

Q: Miksi RAIDZ1 + spare, eikä RAIDZ2 ilman sparea:
A: Hankin aluksi kolme levyä ja hankin sparen jälkeenpäin. En ole tutustunut, että kumpi olisi parempi ratkaisu. Yksi storagepooli koostuu vähintään yhdesteä levysetistä (esim RAIDZ1 setti, RAIDZ2 setti, peilattu setti tai yksittäinen levy). Jos levysettejä on useampia, niin levysettien pitää (ei kuitenkaan pakko, mutta suositus) olla samanlaisia. Eli samaan storagepooliin ei kannata laittaa RAIDZ1 settiä ja RAIDZ2 settiä, tai RAIDZ1 ja MIRROR-settiä. Kun storagepoolissa on useita settejä, niin samaa sparea voidaan jakaa kaikkien settien kanssa.

Lisäksi spare voidaan ehkä säätää sammumaan kun sitä ei käytetä. En ole varma, olenko saanut tätä jo tehtyä (en ole keksinyt tapaa varmistaa asiaa), mutta sen pitäisi kait olla mahdollista. Eli tällöin levyn rikkoontuessa spare ei olisi pyörinyt tyhjillään, vaan olisi ollut paikallaan varastossa.

Valittaessa RAIDZ2:en ja RAIDZ1 + sparen välillä pitää myös hieman pohtia tehokysymyksiä. En ole varma miten RAIDZ2 käyttäytyy nopeuden suhteen, joku muu saa selvittää.

RAIDZ1:stä ei voi muuttaa jälkeenpäin RAIDZ2:ksi. Storagepoolista ei myöskään toistaiseksi voi ottaa levysettejä pois, eli storagepoolin kokoa ei voi pienentää jälkeenpäin!

Kuitenkin laajennustilanteessa voitaisiin luoda uusi storagepooli uusilla levyillä, siirtää kamat offline tilassa vanhalta poolilta uudelle, poistaa vanha pooli ja siirtää vanhan poolin RAIDZ1 + spare uuteen pooliin RAIDZ2:ena (jos se on mielekästä) ja laittaa vaikka uusi spare, joka sitten jaetaan koko poolin kesken.

Q: Nyt kun sinulla homma jo pyörii, niin olisiko jotain komponenttia, joka tuosta kokoonpanosta kannattaisi vaihtaa / valita toisin?
A: Kyllä. Itselläni oli isoja performanssiongelmia Gigabyten emolevyn sisäänrakennetun Realtek 8111B -verkkopiirin kanssa. Ongelmat korjaantuivat ostamalla 25 euron Intelin PCI Gigabittinen verkkokortti.

Q: Oliko ajureiden kanssa mitään ongelmaa?
A: Ei.

Q: Miten hyvin riittää tehot tossa prossussa?
A: Hyvin. Olen harkinnut mm. virtuaalikoneiden hostaamista koneessa, niitä varmaan menisi sinne

Q: Kuin ison CF:n laitoit?
A: Kaksi kappaletta kahden gigan kortteja. Nexentan asennusohjelmassa on bugi, joka estää suoran asennuksen kahden gigan kortille (valittaa, että “kiintolevy” on muutamaa megatavua liian pieni). Tämä on kierrettävissä, mutta en muista juuri nyt tarkasti miten se tapahtuu. Voin kuitenkin opastaa jos jollakulla tulee sama ongelma esiin ja kirjoitan siitä kunnon ohjeet blogiini.

Solaris osaa bootata ZFS:ltä, mutta vain jos ZFS ei sisällä RAIDZ levypakkoja. Eli tarkoitus oli peilata käyttöjärjestelmä kahdelle eri CF kortille. Jostakin syystä kone tunnistaa vain yhden CF kortin. Jos laitan molemmat kortit sisään, niin kone ei tunnista kumpaakaan. Tällä hetkellä minulla on siis systeemilevy vain yhdellä CF:llä. Jos saan joskus koneen tunnistamaan toisenkin CF kortin, niin voin (ymmärtääkseni) lisätä sen lennossa sisään ja peilata systeemilevyn myös toiselle CF kortille.

Q: Näillä näkymin ois tarkotuksena laittaa 6x500GB levyt raid-z2:lla, mutta saapa nähä mitä sitä lopulta keksii.. Meinaa olla ongelma toi ettei pysty levysettiin lisään uusia levyjä, tällä hetkellä on koneessa 3x500GB (jotka ei oo tyhjiä) niin ois kiva saada ne tohon NAS:siin, mutta pitäis siirtää data väliaikasesti “johonki muualle” eli menee vähän hankalaksi.. :)

A: Voit tehdä esim näin: Luot uuden levypoolin johon laitat 5 levyä RAIDZ2:een. Kopioit datat vanhoilta levyiltä tähän uuteen pooliin. Otat vanhat 500 GB levyt ja lisäksi kuudennen ylijääneen levyn ja lisäät ne yhtenä neljän levyn RAIDZ2 settinä uuteen storagepooliin.

Eli levysettiin ei voi lisätä uusia levyjä, mutta storagepooliin voi lisätä uuden levysetin (jolloin pooli “stipettää” datat levysettien välillä joka lisää performanssia)

Q: Tosin kovalevyiksi olen ajatellut 1T levyjä. Onko suositella jotain tiettyä levyä?
A: En osaa suositella. Kannattaa puntaroida hinta-koko suhteen ja haluttujen levyjen määrän kanssa ja valita optimaalinen kokoonpano levyjä.

Q: Oliko vielä joku tietty syy käyttää kahta erillistä 1GB palikkaa yhden 2GB palikan sijaan?
A: Muistit toimivat dualchannel moodissa, eli nopeammin kuin yksi 2GB palikka,.

Pannupizza

Perinteisiä pizzoja tulee tehtyä aina välillä kotona, joskus käyttäen kaupan valmispohjia ja joskus omasta taikinasta tehtyinä. Kuitenkaan en ole koskaan tehnyt varsinaisesti pannupizzaa. Tämä ohje on osittain sovellettuna Cooking For Engineers -sivuilta.

Ainekset:pannupizza

  • 2 dl lämmintä vettä (noin +42 astetta)
  • 3 tl kuivahiivaa
  • 1 tl sokeria
  • 1/2 tl suolaa
  • 4 dl vehnäjauhoja tai pizzajauhoja tai 3 dl vehnäjauhoja ja 1 dl vehnäleseitä
  • Mozzarellajuustoa tai pizzajuustoa reilusti
  • 1 tlk tomaattimurskaa
  • Valkosipulia
  • Suolaa
  • Pippuria
  • Oliiviöljyä
  • Lisäksi täytteitä oman maun mukaan. Itse laitoin pepperonimakkaraa, jalopenoviipaleit, aurajuustoa, ananaspaloja ja aurinkokuivattuja tomaatteja.

Valmistus (tomaattikastike):

  1. Murskaa kaksi valkosipulia pieneen kattilaan (mitä pienempi sen parempi, kunhan sinne mahtuu hyvin purkillinen tomaattimurskaa).
  2. Lisää ruokalusikallinen oliiviöljyä.
  3. Keitä hiljalleen kunnes valkosipuli alkaa kevyesti ruskettua (mutta ei saa palaa!).
  4. Lisää tomaattimurska.
  5. Keitä puolella teholla keitos kasaan, jotta tomaattimurska luovuttaa ylimääräisen nesteen pois.

Valmistus (taikina):

  1. Sekoita keskenään jauhot, kuivahiiva, sokeri ja suola.
  2. Lisää lämmin vesi hitaasti sekoittaen (esim puulastalla).
  3. Vaivaa taikina esimerkiksi öljytyin käsin.
  4. Peitä kulho liinalla ja anna nousta noin kaksinkertaiseksi.

Taikinan noustua kokoa pizza:

  1. Voitele pizzavuoka voilla tai oliiviöljyllä.
  2. Muotoile taikina vuokaan käyttäen käsiä. Pohja saa olla paksu ja taikina saa nousta reilusti reunoille.
  3. Levitä tomaattikastiketta pohjalle.
  4. Mikäli haluat paljon täytteitä lisää osa täytteistä tässä vaiheessa.
  5. Lisää reilusti juustoraastetta
  6. Lisää loput täytteet
  7. Ripottele halutessasi hyvin vähän juustoraastetta täytteiden päälle, mutta älä kuitenkaan hautaa täytteitä juuston alle. Ideana on, että juusto on täytteiden alla, eikä päällä.
  8. Paista 200’C noin 20 minuuttia.

Ultralähikuva hiuksista

Leikimmemokwai-silma-by-jaroneko ystäväni Jaronin loittorenkaalla (Canon EF 25mm II Extension Tube) Assembly Winter tapahtumassa. Loittorengas on kameran ja linssin väliin asennettava palikka, joka siirtää tarkennuspistettä lähemmäs kameraa. Normaalisti käytimme loittorengasta yhdessä Sigman 100-300mm telen kanssa, jolloin loittorenkaan avulla kokoonpano muuttuu voimakkaaksi makro-objektiiviksi. Oheinen lähikuva silmästä on otettu noin puolen metrin etäisyydeltä.

Loittorengas yhdistettynä omaan Sigma 10-20mm laajakulmaan vie kuitenkin tarkennuspisteen vieläkin lähemmäksi kameran linssiä. Itseasiassa kokeilujemme mukaan tarkennuspiste oli objektiivin uloimman linssin ja UV-suojan välissä! Tämä ei estänyt meitä yrittämästä ottaa lähikuvia ystävämme hiuksista. Oheinen kuva saatiin laittamalla kamera kiinni ystäväni hiusnutturaan ja kohdistamalla nutturaan point-blank -etäisyydeltä kolme voimakasta salamaa kauko-ohjattuina käyttäen Canonin Speedlite Transmiter ST-E2 -lähetintä.

foxin-hiukset-closeup

Itselläni tuli hiuksista mieleen jokin muovikuitu tai valokuitu, kun niitä tarkastelee tältä etäisyydeltä.

Importing P2 video data to Final Cut and problems with partition formats

We had some problems with importing video from a P2 card to Final Cut Pro. It seems that the P2 contents can not be inside a HFS+ volume. At least that’s the only reasonable common thing which we found as we hammered out heads against the wall for the better part of the day. We tried to copy the P2 contents to an external harddrive, which we transported to the editing machine. We were using Final Cut Pro 6.0.2 with latests (as retrieved from Panasonic site March 23, 2008) P2 drivers for OS X. Once we formated a small portable disk to single primary partition formated to FAT32 the Final Cut finally found the contents and we were able to leave for Sauna while FCP imported the videos \o/

Sienikatkarapupasta – Erilaisia sieniä ja katkarapuja

Pastaa pastan perään. Tämä on mukaelma toisesta niistä kahdesta ruuasta, mitä opin tekemään jo vuosia sitten, kun asuin vielä vanhempieni luona. Alkuperäistä reseptiä en muistanut, eikä vanhemmatkaan olleet kotona (terveisiä Turkuun), jotta olisivat voineet sen kaivaa jostakin, mutta tässä on ihan onnistunut mukaelma. Lyhykäisyydessään tämä on sienistä ja katkaravuista koostuva pastakastike ja vieläpä melko nopea tehdä.

Ainekset (noin kahdelle):sienikatkarapupastaa

  • Sipuli pilkottuna
  • Öljyä paistamiseen
  • Valkosipulia maun mukaan
  • Paprikoita suikaleina
  • Erilaisia sieniä yhteensä noin yksi rasia
  • Katkarapuja noin 150 g
  • Ranskankermaa
  • Mustapippuria
  • Yrttisuolaa
  • Muita mausteita (Esim chiliä) oman maun mukaan
  • Balsamicoviinietikkaa tilkka

Valmistus:

  1. Puhdista sienet. Sieniä ei kannata huuhdella vedessä, vaan putsata ne esimerkiksi pullasudilla. Tämä on kaikista aikaavievin osuus.
  2. Laita pasta tulemaan.
  3. Pilko sipuli ja paprikat ja kuullota ne öljyssä
  4. Lisää pilkotut sienet
  5. Lisää ranskankerma
  6. Lisää katkaravut
  7. Lisää mausteet.
  8. Sekoita kastike keitetyn nauhapastan joukkoon ja tarjoile heti.

Itse käytin kahta eri sienilajiketta, ostin kumpiakin yhden rasian ja käytin molempia noin puoli rasiallista. Loput meni jääkaappiin odottamaan seuraavaa päivää. Itse kastike on erittäin nopea valmistaa, aikaavievin osuus on sienien putsaus, joten laita pasta ajoissa kiehumaan. Muista, ettei herkkusieniä saa keittää, koska ne sitkistyvät.

Italialainen lihapullapata

Luulin jo etten saisi tästä koskaan kuvia ulos. Jostakin syystä kamera hangoitteli hirveästi vastaan ja sain kuvat ulos vasta monien yrityksien jälkeen. Pitää tutkia onko kysymys muistikortista (luultavaa) vai kamerasta. Tämä ohje on peräisin pastanjauhantaa -blogista, tosin hieman muokattuna. Ylipäänsä tämä oli ensimmäinen kerta koskaan, kun teen lihapullia itse. Olen kuullut hirveästi kauhutarinoita lihapullien tekemisen vaikeudesta, mutta nämä onnistuivat todella helposti, ilman mitään ongelmia! Suosittelen kokeilemaan.

Ainekset:lihapullapata

  • 800 g paistijauhelihaa
  • pilkottua sipulia
  • paketti pekonia pilkottuna
  • 100 g parmesaania raastettuna
  • 1,5 dl korppujauhoja
  • tilkka maitoa
  • kaksi munaa
  • 1 dl persiljasilppua
  • 1 prk paseerattua tomaattia
  • 1 prk tomaattimurskaa
  • 3 kynttä valkosipulia
  • 50 g voita ja 2 rkl oliiviöljyä paistamiseen
  • suolaa ja mustapippuria myllystä

Valmistus:

  1. Sekoita tarpeeksi isossa kulhossa korppujauhot, munat ja tilkka maitoa. Anna imeytyä hetki
  2. Sekoita joukkoon jauheliha, pekonisilppu, persilija ja valkosipuli.
  3. Mausta suolalla ja mustapippurilla. Kämppikseni vihjasi, että suolaa kannattaa olla lihapullissa tarpeeksi.
  4. Sekoita taikinaksi ja pyörittele pulliksi.
  5. Paista pullat öljy-voi -seoksessa esimerkiksi paistinpannulla, kunnes pullilla on sopiva ruskea pinta. Sisäpuolelta pullat saavat olla vielä raakoja.
  6. Siirrä paistunut pulla isoon kattilaan, johon olet ennalta kaatanut tomaatit. Mausteeksi voi laittaa timjaminoksia.
  7. Sekoita hyvin varovasti ja hauduta miedolla lämmöllä ainakin tunti. Lihapullat kypsyvät tässä vaiheessa sisältä.

Lisukkeeksi voi keittää esimerkiksi pastaa tai spagettia suola-öljy -vedessä. Itse tosin malttanut näin tehdä, vaan söin ensimmäisen annoksen ilman lisukkeita. Seuraavana päivänä sitten keitin mukana spagettia :)

Linssikeitto

Eräänä päivänä muistin, että äiti oli ostanut minulle joskus linssejä, koska olin pitänyt hänen tekemästään linssikeitosta. Linssit olivat vielä kuivakaapissa, joten kaivoin jostakin sopivan linssikeiton reseptin ja kävin ostamassa kaupasta ainekset. Ikävä kyllä linssit olivat menneet vanhaksi noin kaksi vuotta sitten ja muuttuneet jonkinlaiseksi linssijauhoksi. Onneksi kauppa on alakerrassa :)

Ainekset:linssikeitto

  • 2-3 sipulia
  • 2-3 valkosipulin kynttä
  • 500 g tomaattimurskaa
  • 3 dl punaisia linssejä
  • kasvisliemikuutio
  • chiliä
  • basilikaa
  • öljyä paistamiseen

Valmistus:

  1. Kuullota sipuli öljyn kanssa.
  2. Lisää tomaattimurska ja vesi. Sekoita hyvin
  3. Lisää kasvisliemikuutio ja chili.
  4. Lisää hyvin huuhdellut linssit.
  5. Keitä hiljalleen noin puoli tuntia.
  6. Lisää basilika.

Lisää vettä jos keitto meinaa mennä liian kiinteäksi. Tarjoile ruisleivän kanssa. Varoitus: Ainakin itselläni keitto aiheutti pieniä ilmavaivoja, mikä ei tosin makua pilannut. Nams!

Tomaattibasilikapastakastike

Suorastaan ihmettelen miksi en ole kirjoittanut tätä ohjetta tänne aikaisemmin. Pasta tomaattibasilikakastikkeella on eräs ensimmäisistä ruuista mitä opin valmistamaan. Ohje löytyi jostain äidin keittokirjasta kotona jo useita vuosia sitten. Tämä on muuten *se* ruoka mitä tämän blogin ruokasivun fiiliskuvassa kaverit nauttivat krapulaan eräänä kauniina sunnuntaina *plur*.

Ainekset (suhteet hieman vaihtelevat, tästä syö 3-5 henkeä): tomaattibasilikapasta

  • Sopivaa pastaa
  • Kolme purkkia tomaattimurskaa (à 500g)
  • Yksi purkki paseerattua tomaattia
  • Ruokakermaa
  • Tuoretta basilikaa
  • Kuivattua basilikaa (maustehyllystä)
  • Hunajaa (mieluiten juoksevaa)
  • Parmesaania päälle
  • Sipulia
  • Valkosipulia (jos tykkää)
  • Suolaa ja mustapippuria oman maun mukaan.
  • Oliiviöljyä sipulien kuullottamiseen

Valmistus:

  1. Kuullota sipuli ja valkosipuili isossa kattilassa
  2. Lisää tomaatit ja reilusti kuivattua basilikaa
  3. Keittele ainakin kymmenen minuuttia välillä sekottaen
  4. Lisää hunajaa ja sekoita hyvin
  5. Lisää tuoreita basilikalehtiä (jos niitä on saatavilla)
  6. Lisää kerma, sekoita hyvin ja lämmitä kunnes rupeaa juuri ja juuri kiehumaan, jonka jälkeen siirrä kattila pois levyltä.

Itse keitän pastan suolavedessä öljyn kanssa. Öljyä voi myös lisätä valmiiseen pastaan hieman, jotta se pysyy edelleen “juoksevana” eikä takerru toisiinsa. Mittasuhteet ovat hyvin summittaiset, en muista alkuperäisen ohjeen määriä, mutta basilikaa tulee runsaasti :)

Tursajaiset-video

Sain viimeviikon tiistaina Gravitaation jatkoilla idean tehdä videoproduktio seuraavan päivän STADIAn Tursajaisista. Sain haalittua toimivan käsikirjoituksen lisäksi kasaan kolmen hengen kuvausryhmän: toimittajana Stobe, äänimiehenä Valtteri ja toisena kameramiehenä Jekku. Tässä lopputulos (video, 66 Mt, voit joutua odottamaan että video latautuu kokonaisuudessaan. Alla näkyvä mediasoitin näyttää latauksen edistymisen).

[kml_flashembed video=”/media/tursajaiset-k2008-final.mp4″ /]

Jos blogkuvavideo ei toimi, käy päivittämässä selaimeesi uusin Flash Player täältä (vaatii selaimen uudelleenkäynnistyksen). Tämä on täysin normaali operaatio, sinulla on mitä luultavammin jokin Flash playerin versio asennettuna (esim youtube käyttää flash playeriä), sinun tarvitsee ainoastaan päivittää se. Jos video ei kaikesta huolimatta näy, niin jätä kommentti, niin yritän ratkaista asian tavalla tai toisella.

Ja ihan yleisesti jättäkää kommentteja, on kiva kuulla mitä muut pitävät tästä =)